
Yield forecasts with reasons
A forecast per field, with a range and the factors behind it.
- DATA
- Sentinel-2, weather, soil, StatCan
- OUTPUTS
- Forecast, range, reasons per field
- TYPICAL TIME
- Mid-season onward
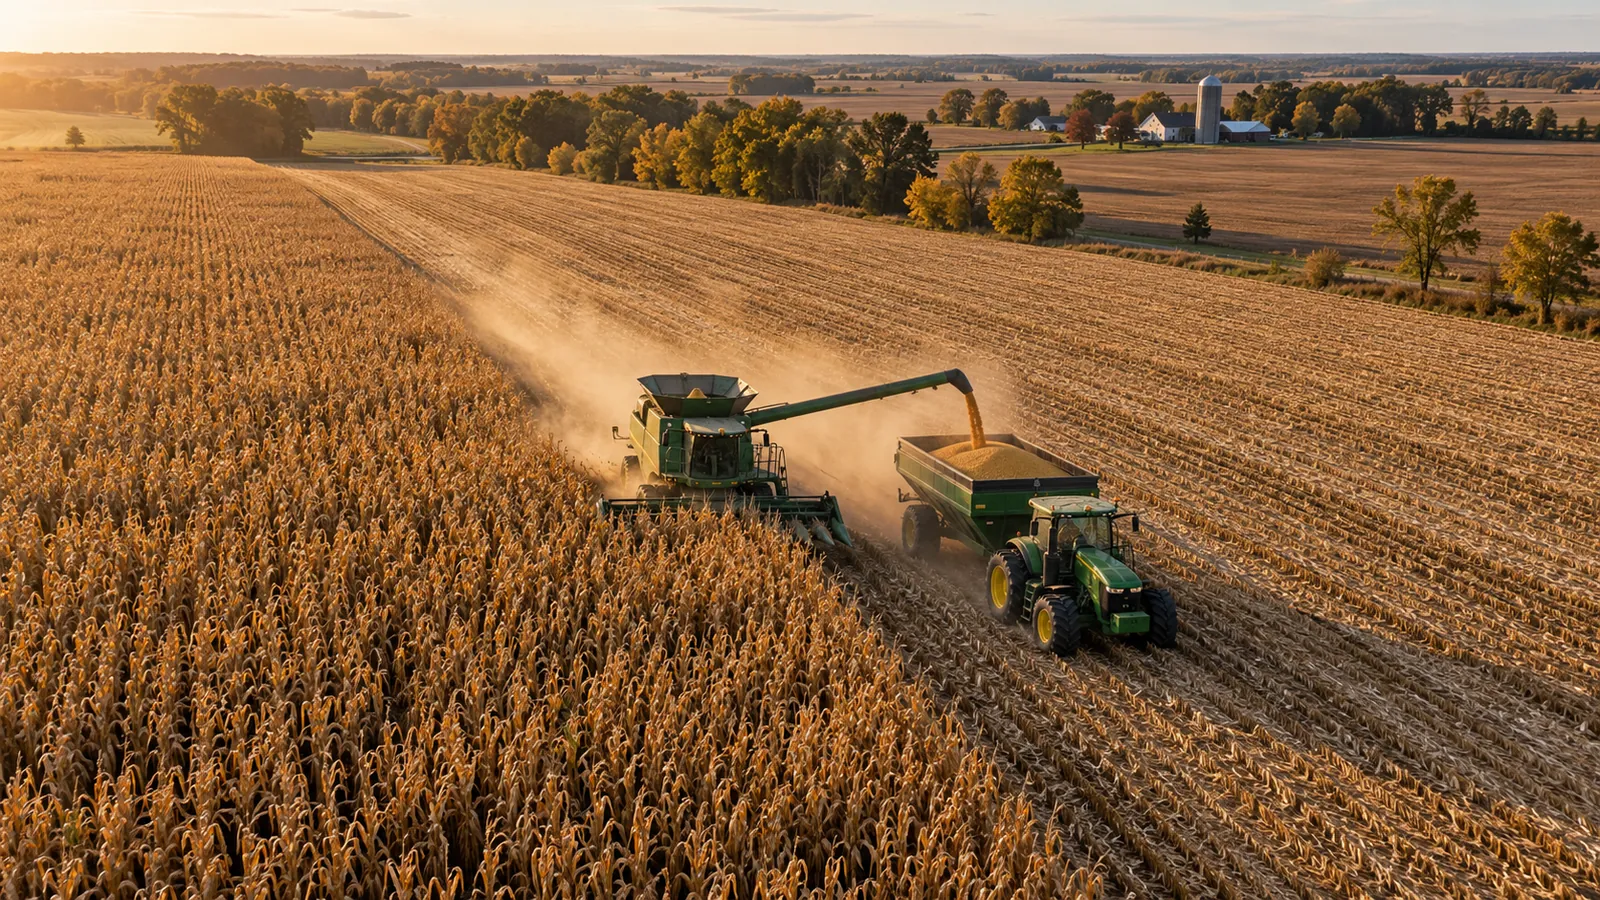
What you can do with it
- 01Plan storage, sales and logistics with a range, not a single number
- 02See which factors raise or lower each field’s forecast
- 03Check the forecast against what you know about the field
- 04Compare the forecast with the regional baseline
METHOD
How it is made
Every number names its data and its limits.
- DATA USED
- Season crop-health record per field, daily weather (Open-Meteo), soil properties (SoilGrids), regional yields (Statistics Canada).
- METHOD OR MODEL
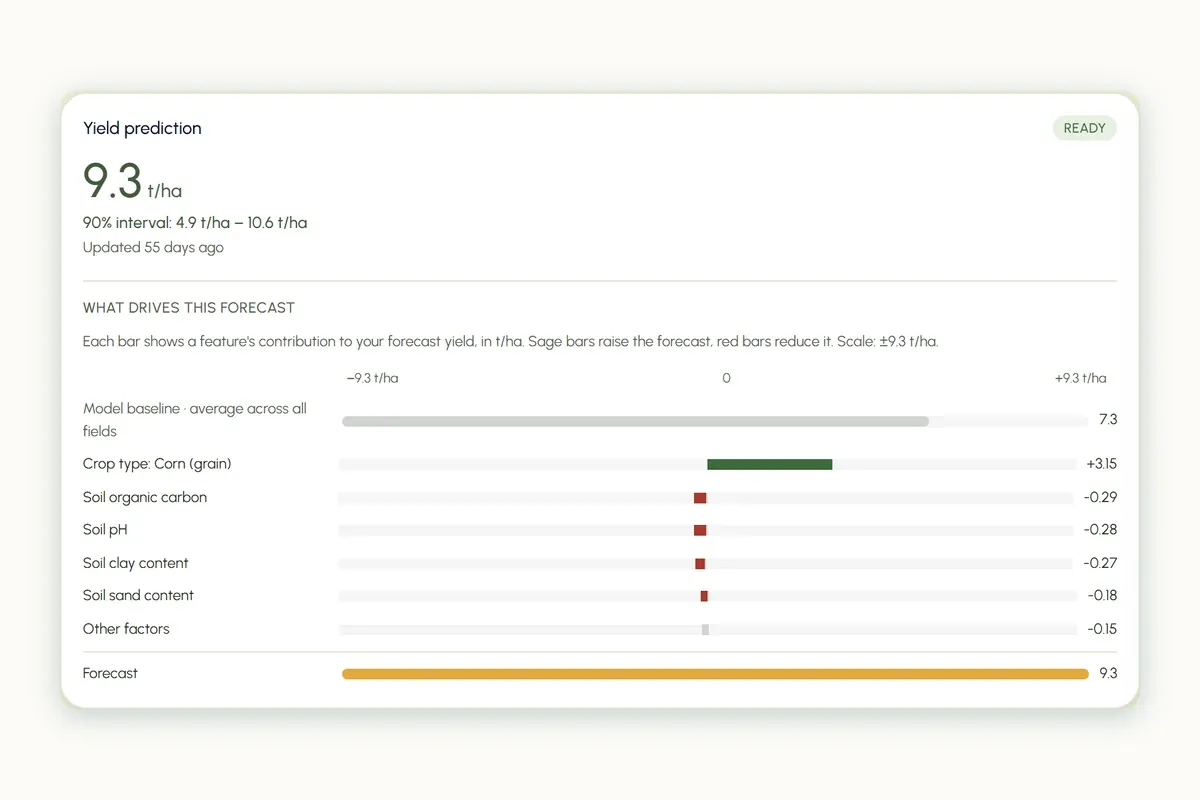
- Gradient-boosted model trained on past Ontario seasons. Each forecast comes with its factor contributions (SHAP) in t/ha and a 90% range.
- ACCURACY AS MEASURED
- R² 0.89 on seasons the model never saw, measured on the AgriLens demo farm. Your fields: measured on your data during discovery.
- WHAT THIS DOES NOT TELL YOU
- The forecast reflects conditions seen so far; a late storm or early frost is not in it. Small or unusual fields have wider ranges.
- LANGUAGES
- English and French
WHAT YOU RECEIVE
Maps and data in your formats
- Forecast table (CSV)
- Factor chart per field (PDF)
- GeoPackage with forecasts per field
- Dashboard (AgriLens)
WHAT WE NEED FROM YOU
- Field outlines and crop per field
- Past yields per field, if available (improves the model)
- Your harvest timing
WHAT WE PREPARE
- Season record per field
- Model training and testing on held-out seasons
- Factor explanations and ranges
- Report and dashboard
Steps and time
- Discovery2–4 weeksModel tested on your past seasons, accuracy reported
- Build3–4 weeksForecast pipeline and explanations for your fields
- RunEach seasonForecasts updated through the season
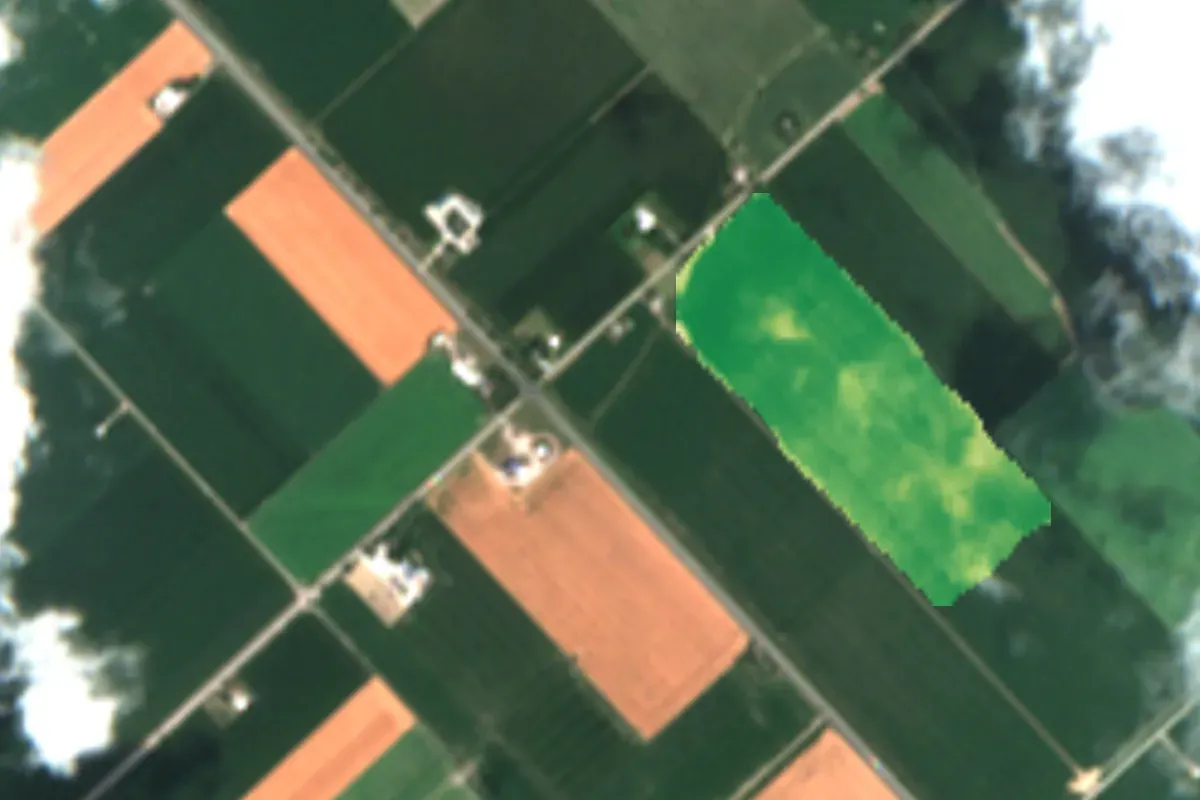 Contains modified Copernicus Sentinel data 2026LIVE IN AGRILENSCrop health mapsWhere each field grows well or falls behind, after every clear pass
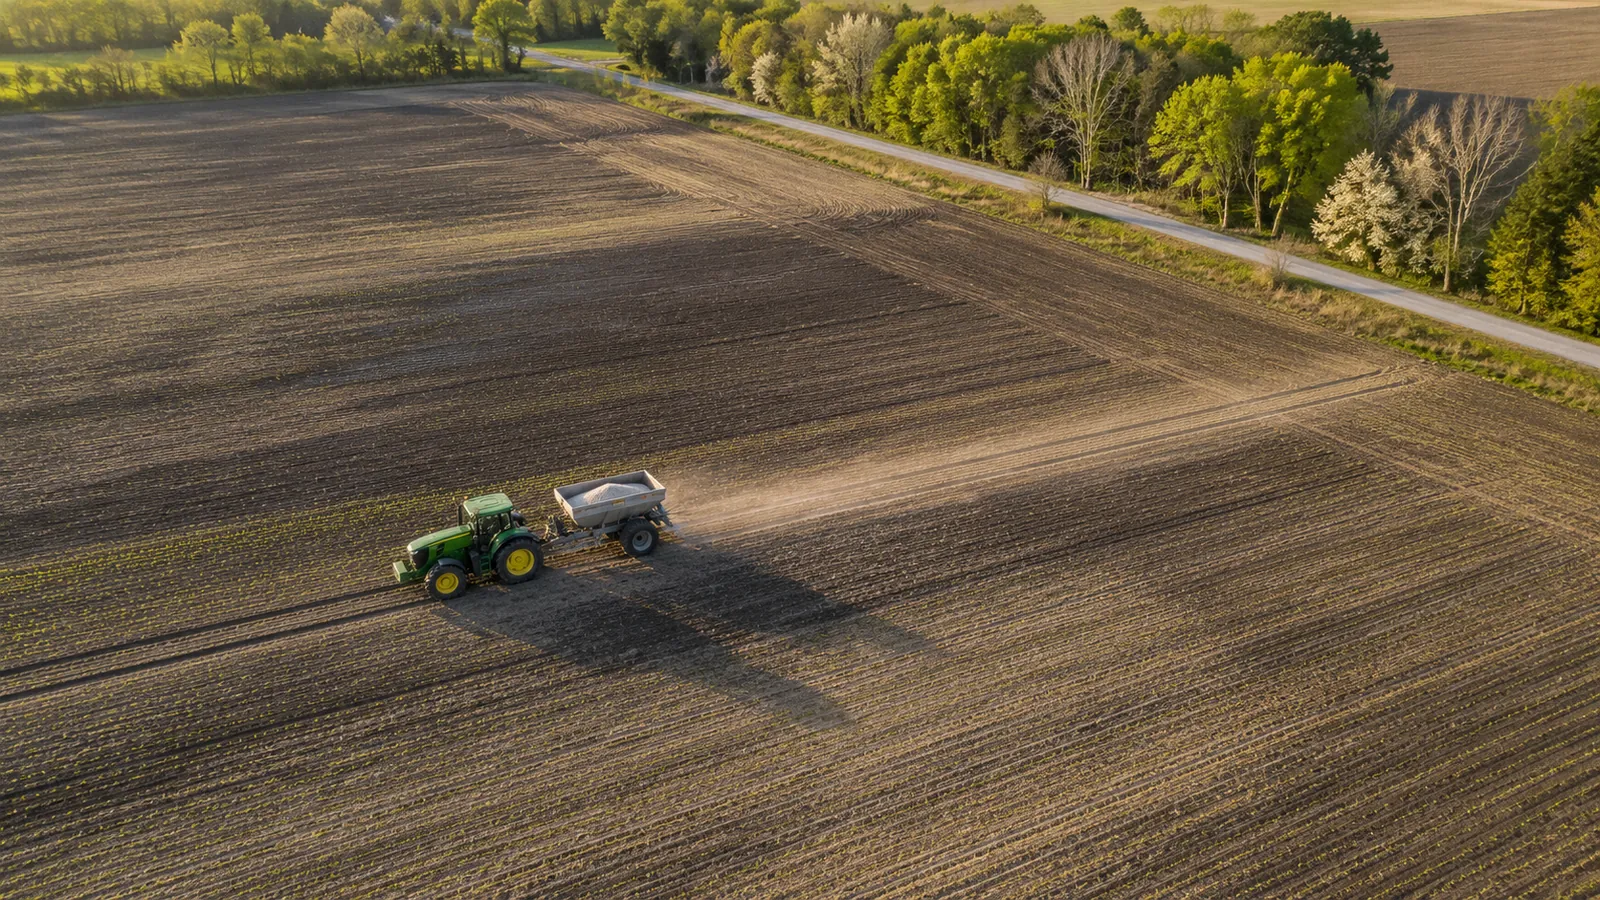 LIVE IN AGRILENSFertilizer zonesZones from red-edge imagery, with Ontario guide rates
 LIVE IN AGRILENSClimate outlookTemperature and rainfall scenarios to 2100 for your area
DISCUSS THIS SOLUTION
Tell us about your area
We reply with a first view on whether this fits, and what discovery would cover.