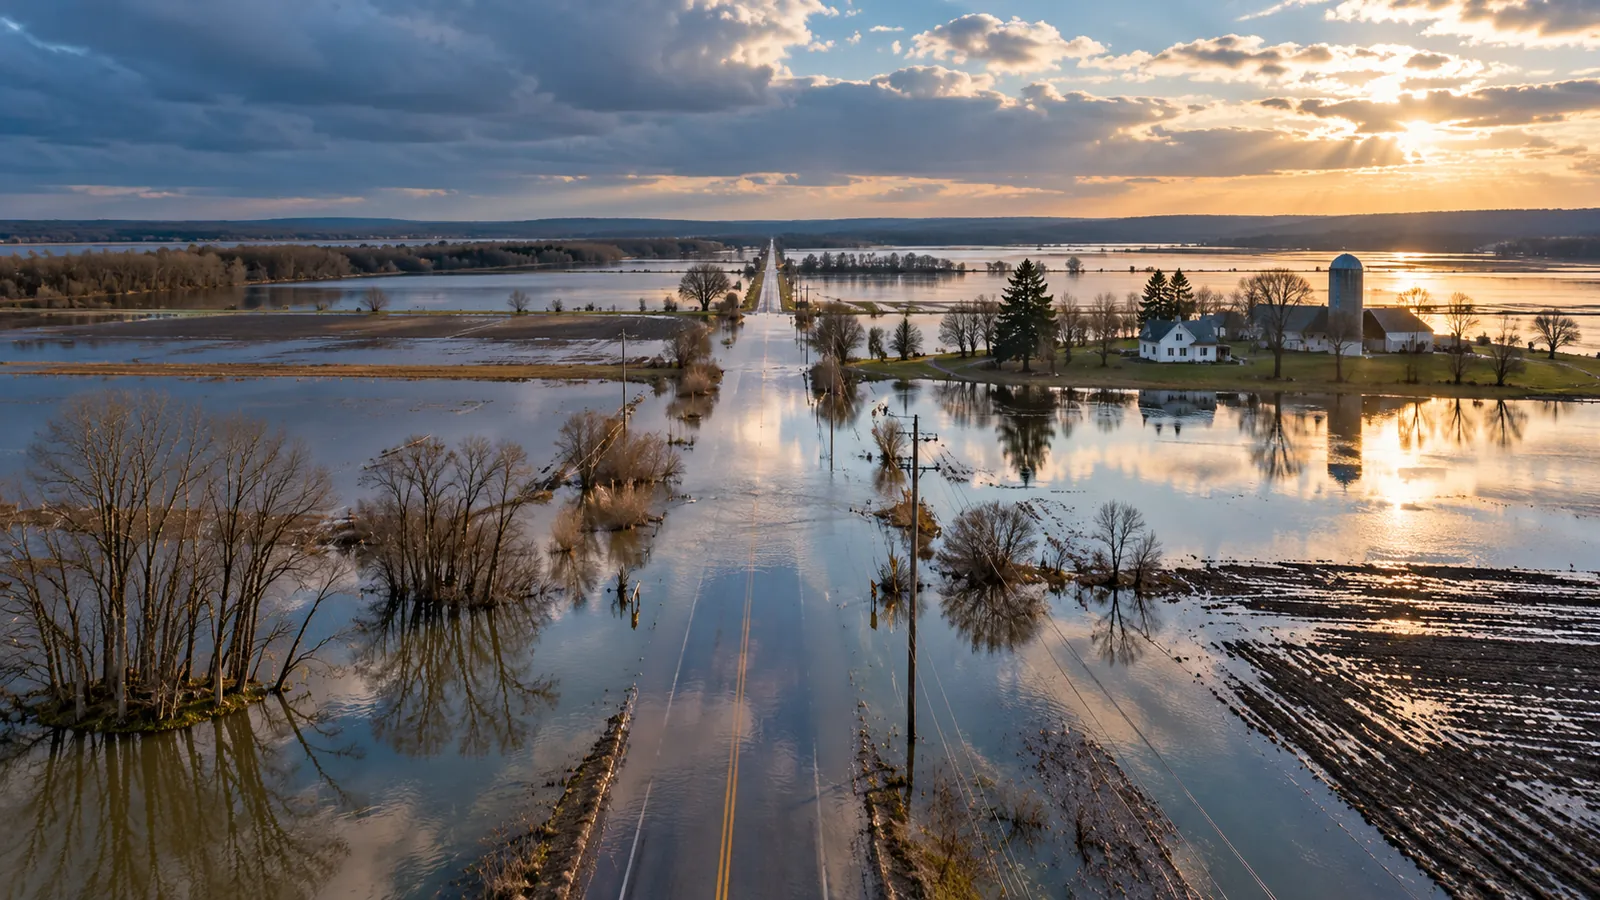
Flooded rural road beside farm fields after a storm

INDUSTRIES · CLIMATE RISK AND RESILIENCE

Knowyourexposuretoflood,fire,droughtandheat

For municipalities, conservation authorities, insurers and lenders. We map what has happened on the land, where risk is growing, and what it means for the places you are responsible for.
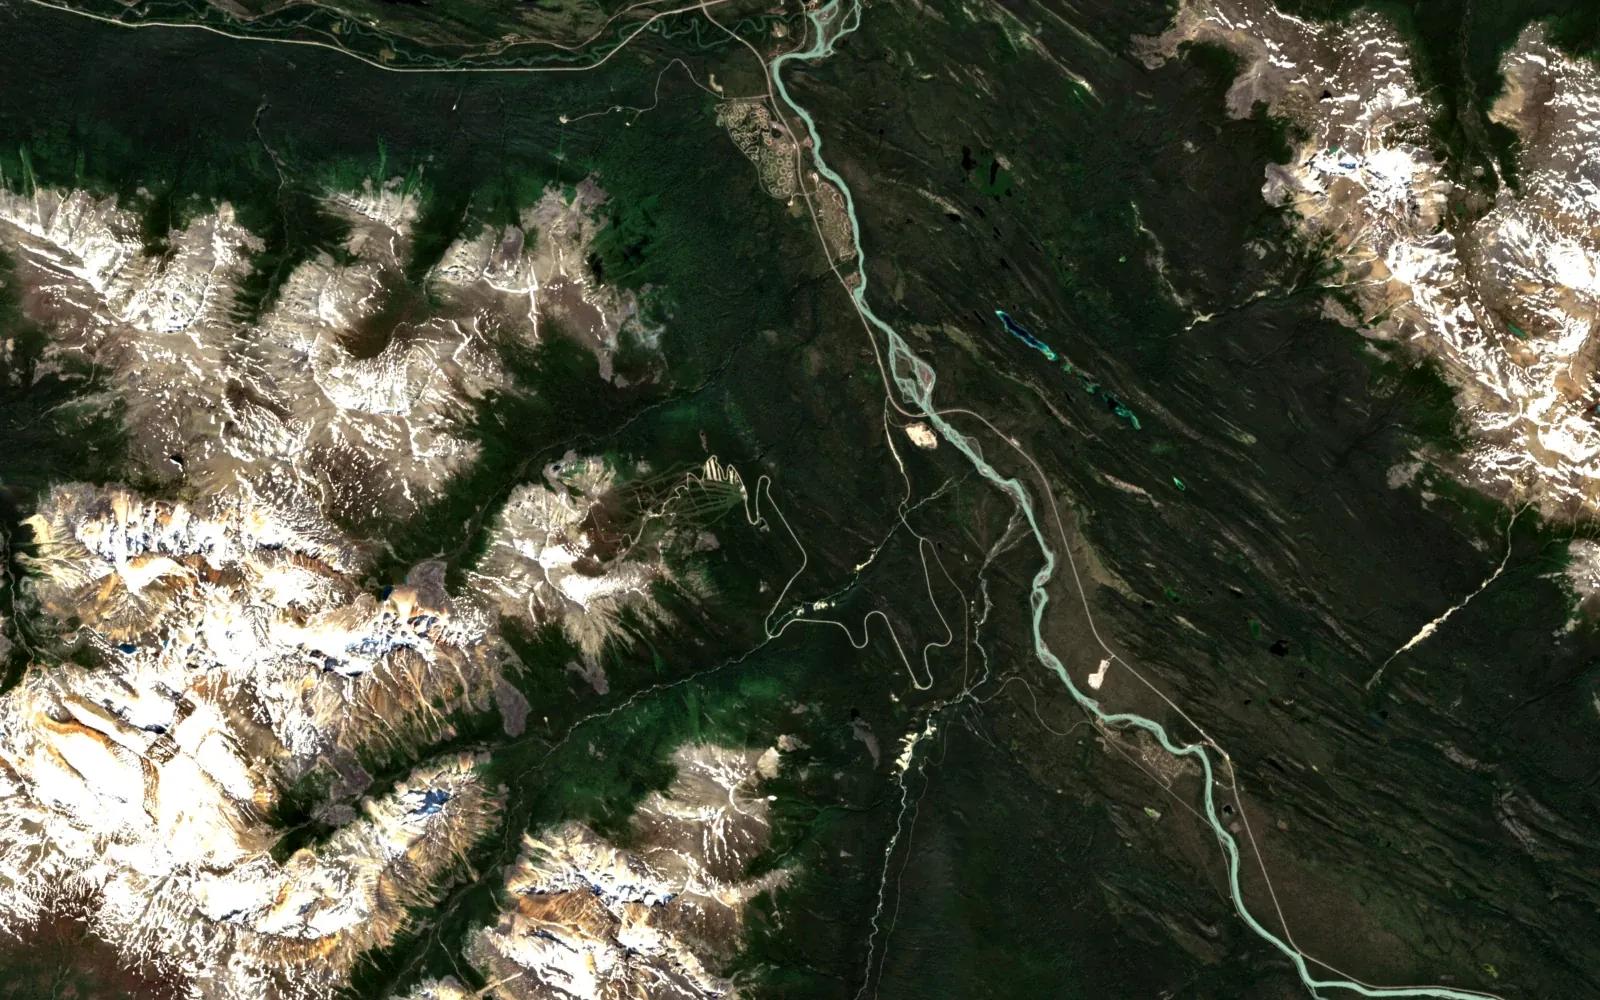
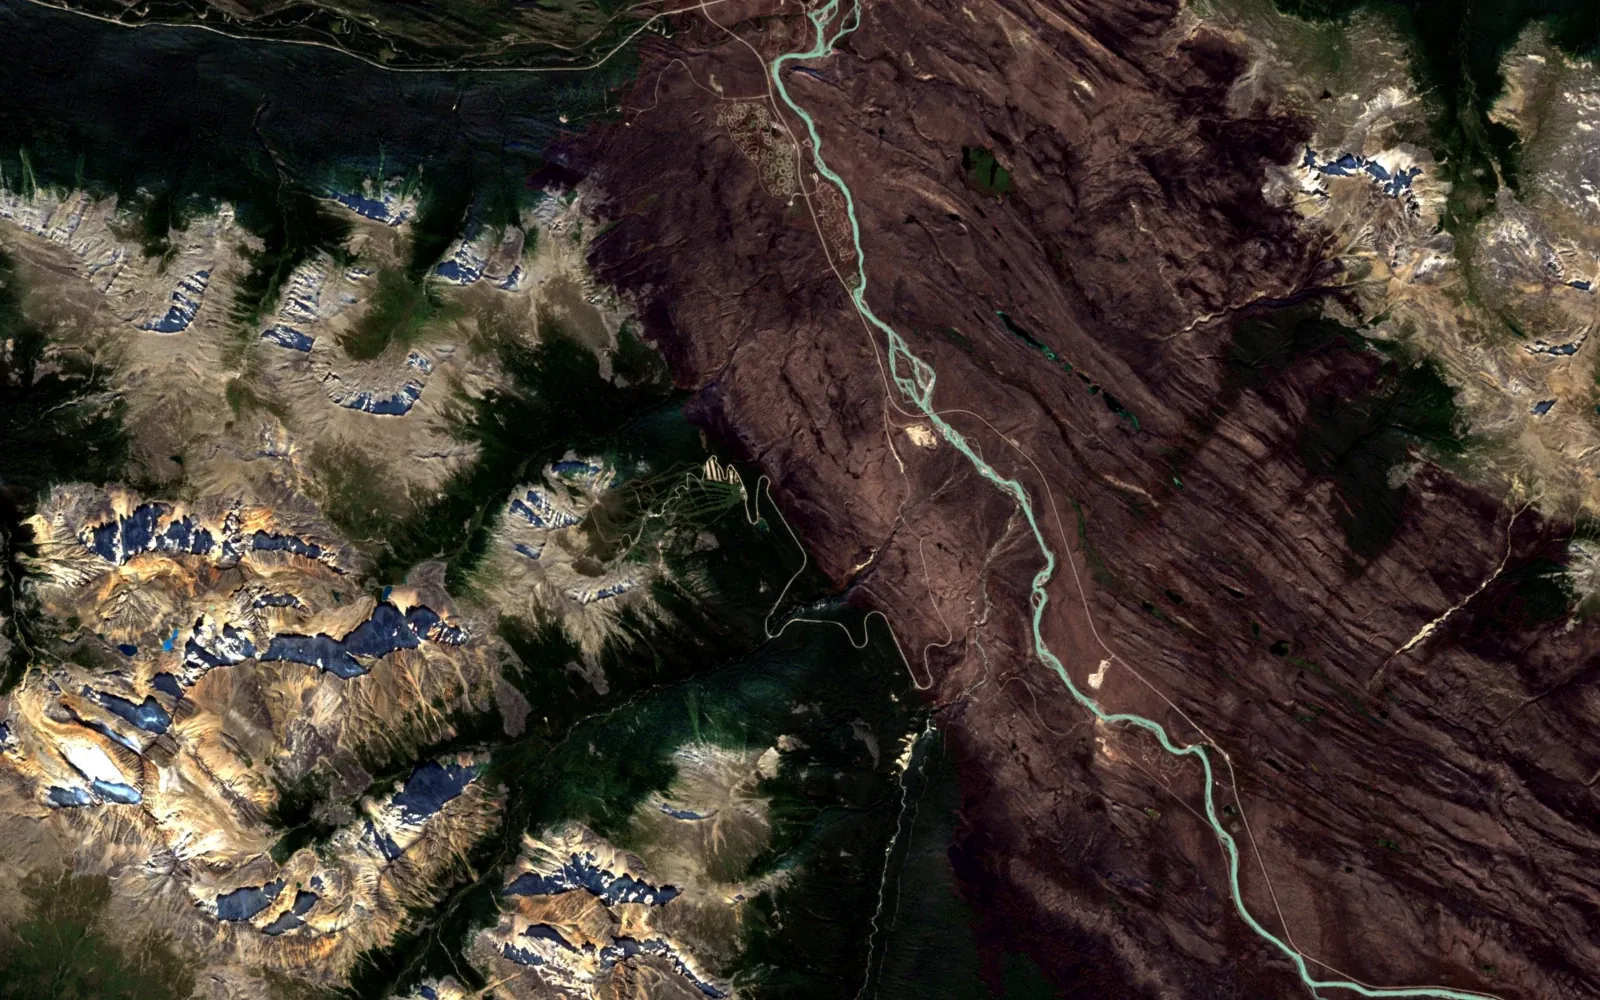
Jasper National Park, Athabasca valley, 7 July 2024, before the fireSame area, 5 September 2024, after the fire; the burned valley shows brown
5 September 20247 July 2024
Jasper National Park, Alberta, Athabasca valley south of the townsite · Sentinel-2 true colour, 24 × 15 km · Contains modified Copernicus Sentinel data 2024Drag to compare
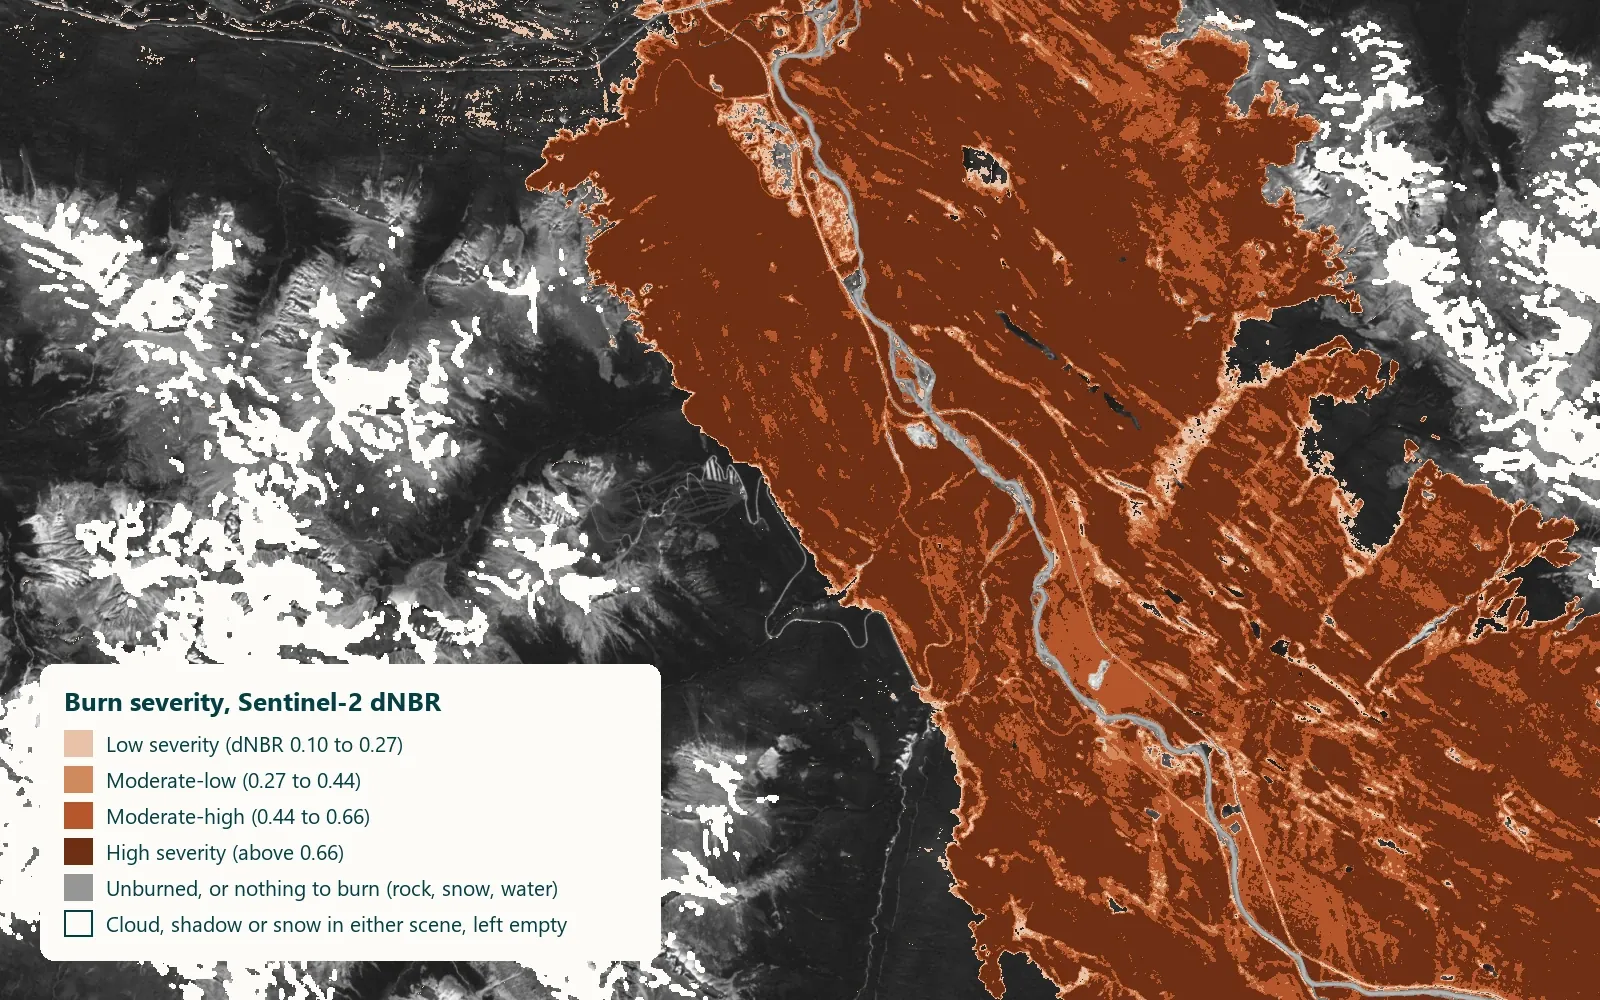
Burn severity map of the Jasper fire from Sentinel-2 dNBR, with legend
Burn severity from Sentinel-2 (dNBR, 7 July to 5 September 2024), Jasper National Park. Grey: unburned or nothing to burn; empty: cloud, shadow or snow · Contains modified Copernicus Sentinel data 2024
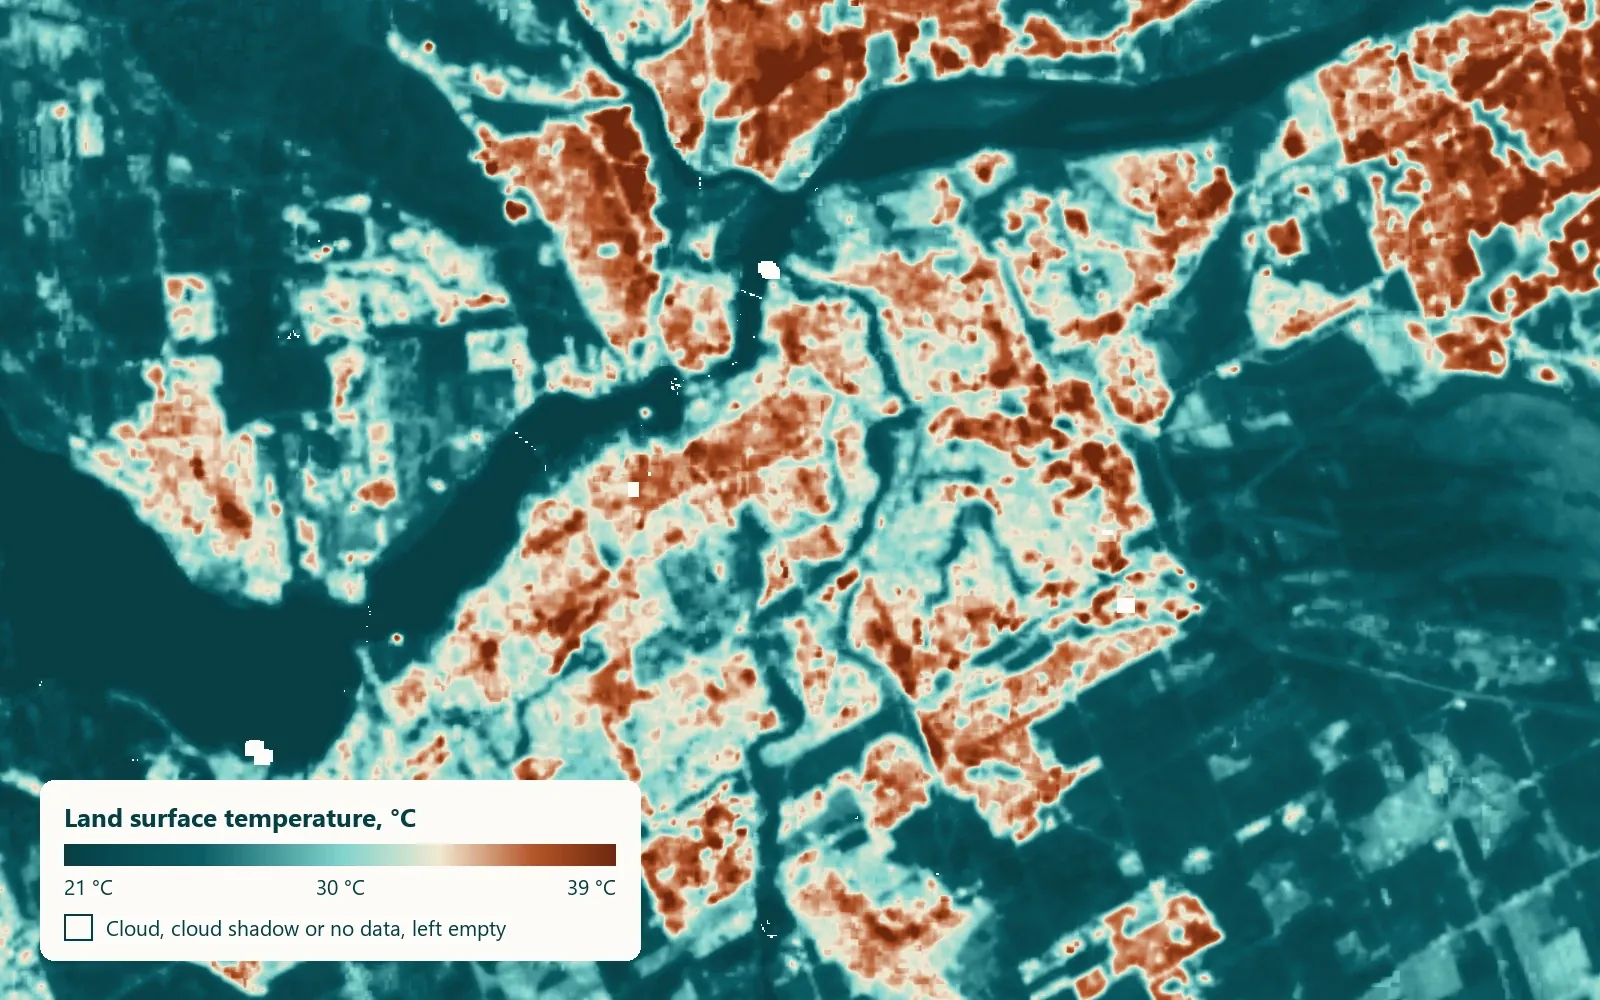
Land surface temperature map of Ottawa–Gatineau from Landsat 8, 21 to 39 °C
Land surface temperature, Ottawa–Gatineau, Landsat 8, 5 July 2026 (11:50 local), 21 to 39 °C. Surface temperature, not air temperature · Landsat data courtesy of the U.S. Geological Survey

WHAT WE MAP

Five services, each delivered as a project

All climate services are on request. Open a card for an example.
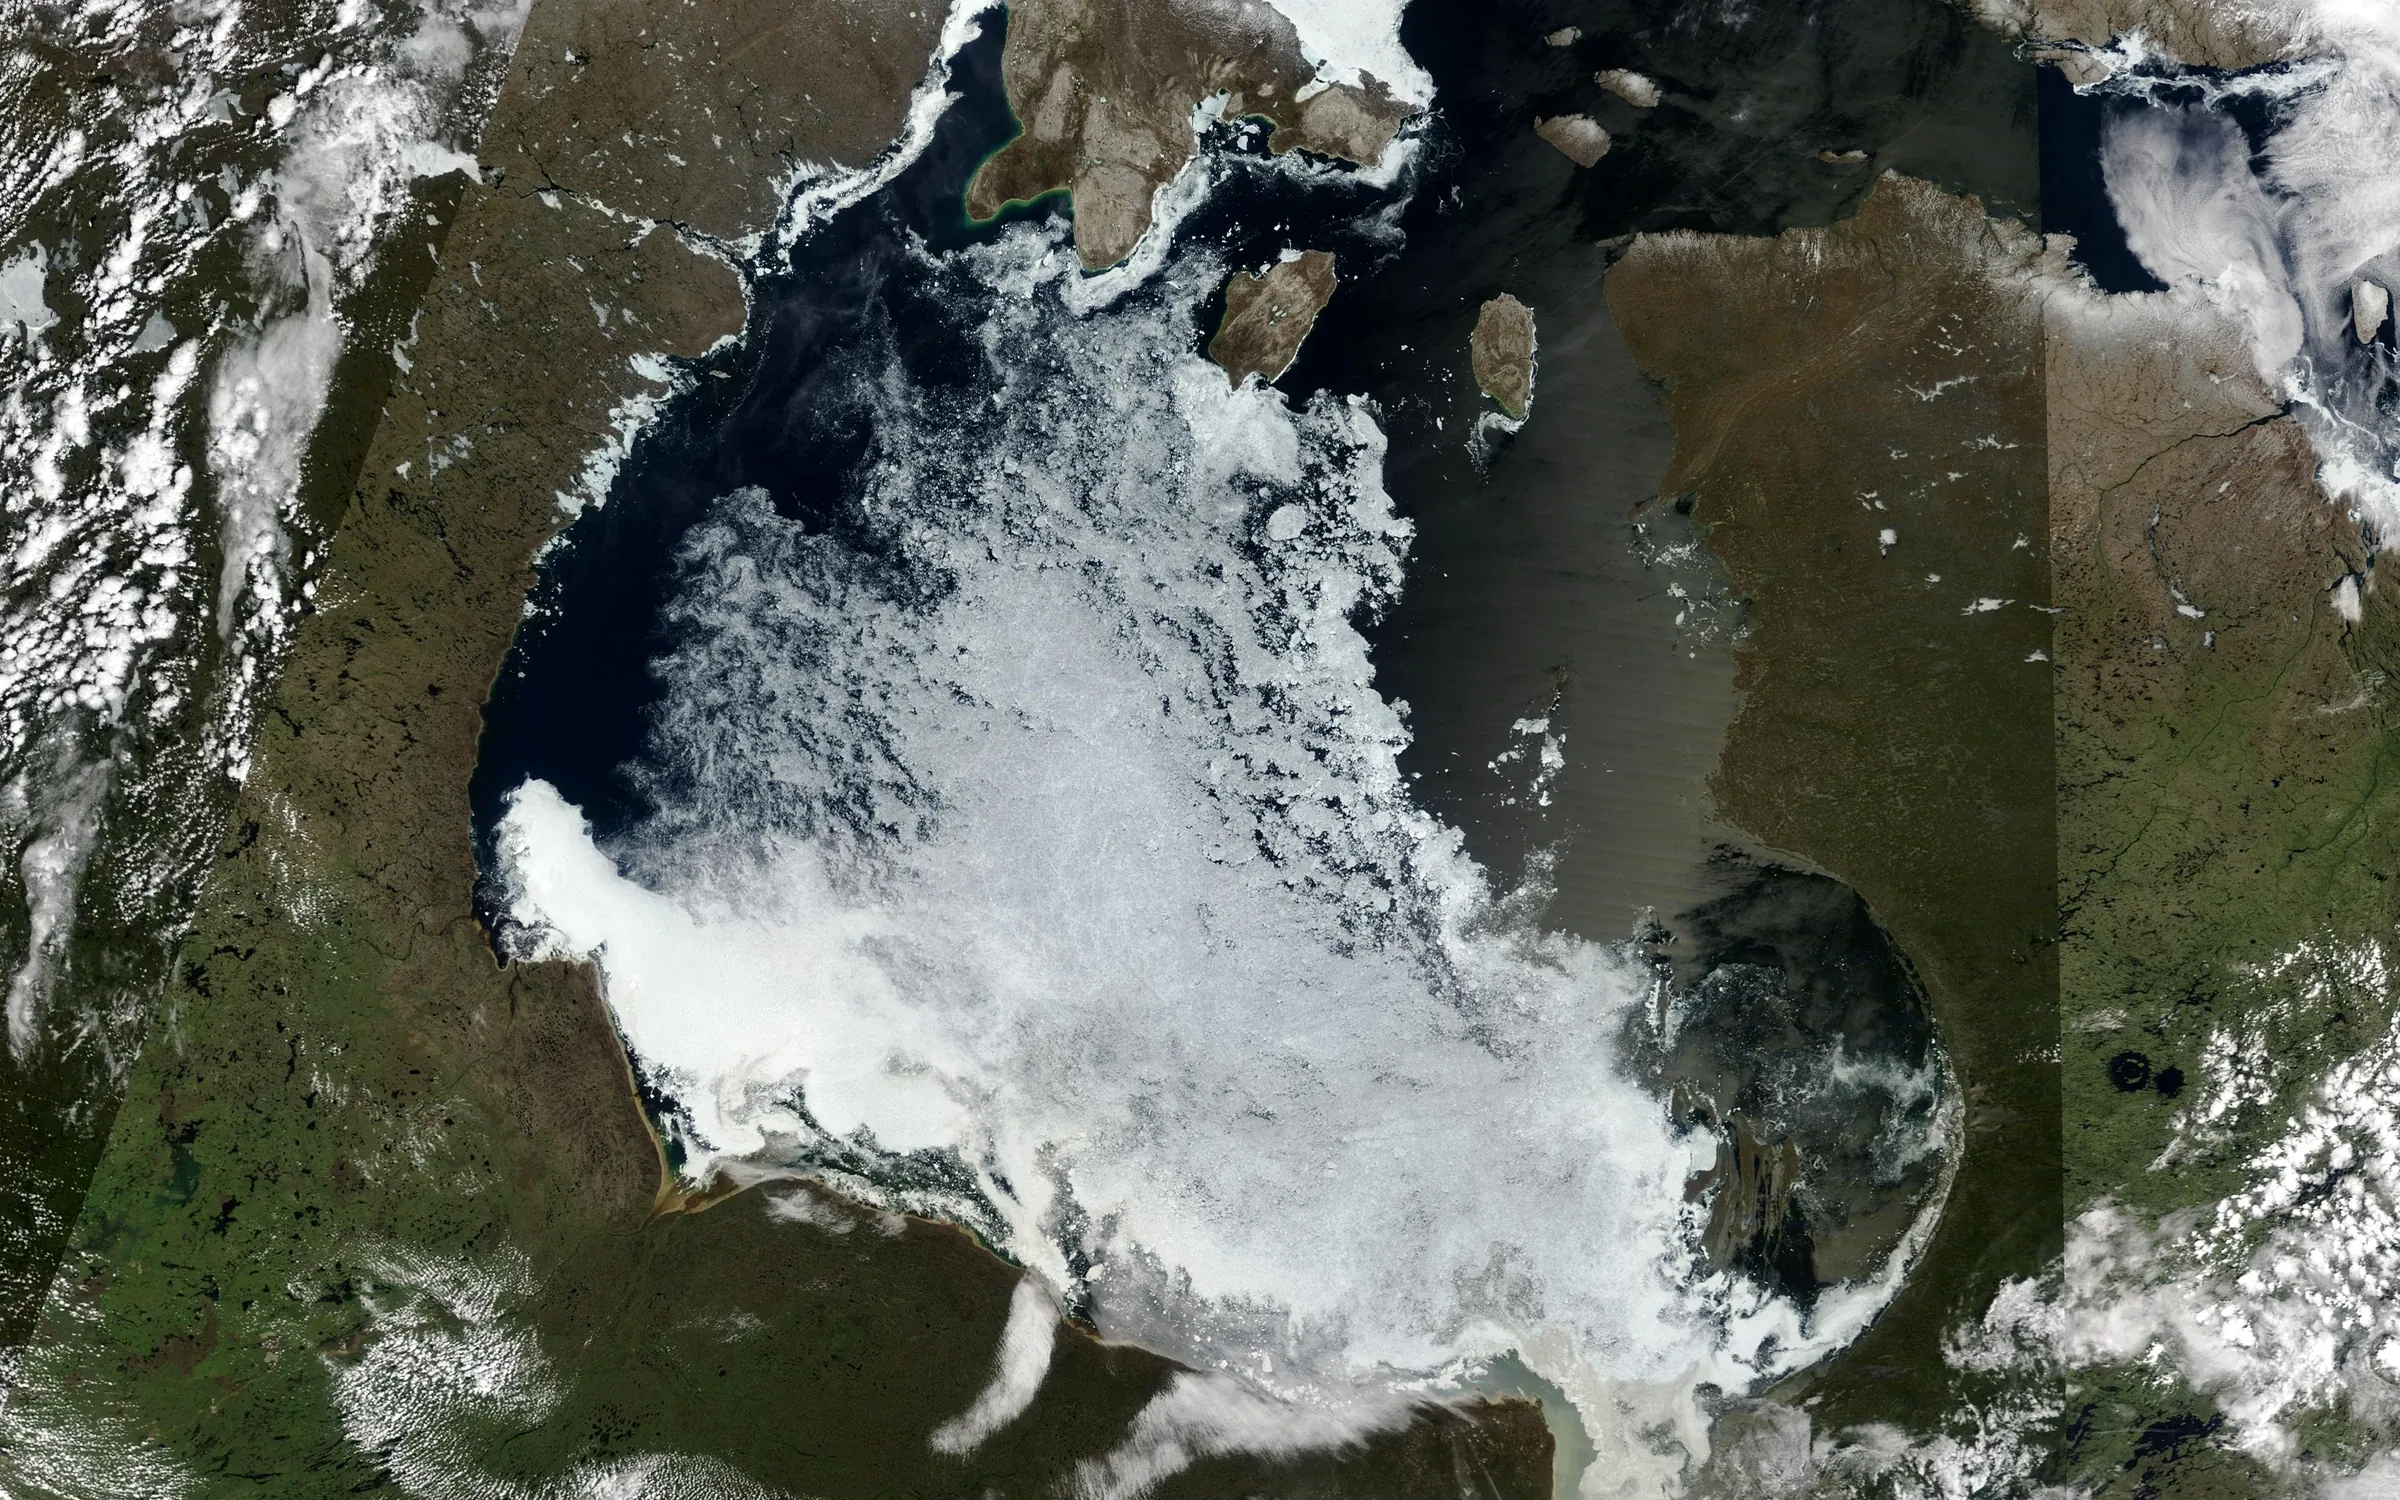
Hudson Bay ice break-up, MODIS Terra
Hudson Bay ice break-up · MODIS Terra · 22 Jun 2026 · NASA Worldview

Discovery, Build, Run

A watershed, a city, a portfolio. Tell us which place you're responsible for.

Discuss your project