
Fertilizer zones
Zones from red-edge imagery, with Ontario guide rates.
- DATA
- Sentinel-2 red-edge, crop-health history
- OUTPUTS
- Zone map, rate table, GIS layers
- TYPICAL TIME
- Before side-dress
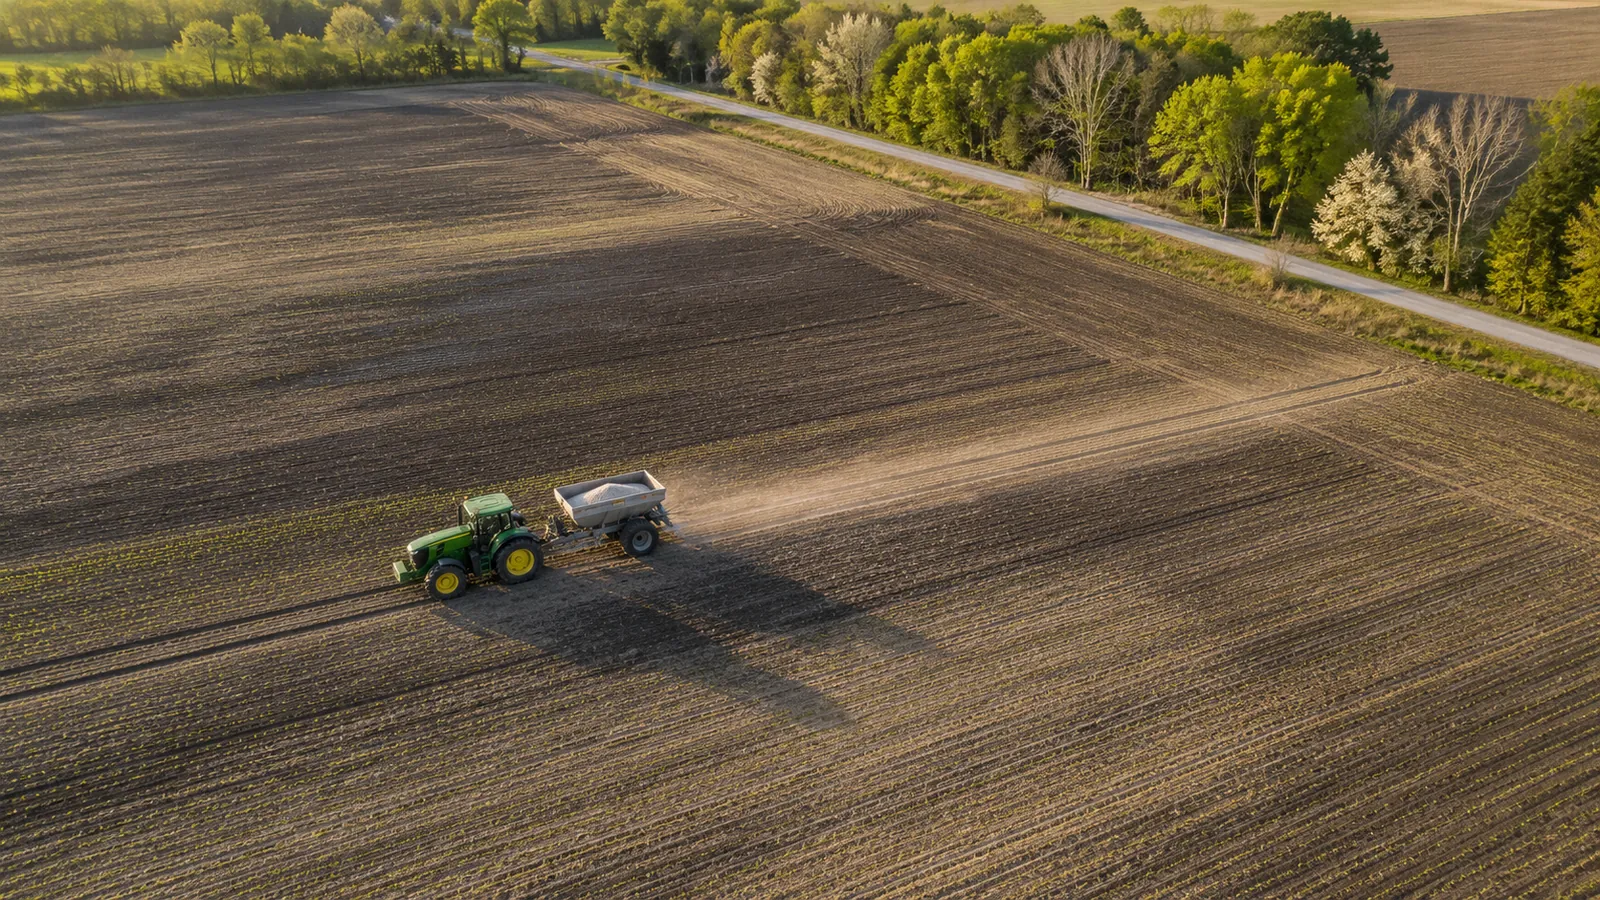
What you can do with it
- 01Split each field into low, medium and high zones from its own history
- 02Start from the Ontario guide rate for each zone, with the source named
- 03Export zones to the spreader or the agronomist
- 04Keep a zone record season after season
METHOD
How it is made
Every number names its data and its limits.
- DATA USED
- Sentinel-2 red-edge bands and the crop-health record for each field; crop and planting date from you.
- METHOD OR MODEL
- Zones from the multi-pass vegetation pattern inside the field, classed into three levels. Nitrogen rates start from OMAFRA Publication 811 and are shown with the guideline they come from.
- ACCURACY AS MEASURED
- Zones are a relative map of the field, checked against any yield maps or soil tests you hold. Rates are the provincial guide, not a prescription.
- WHAT THIS DOES NOT TELL YOU
- A zone says where the crop has been weaker or stronger. It does not say why, and it does not replace a soil test or an agronomist’s judgement.
- LANGUAGES
- English and French
WHAT YOU RECEIVE
Maps and data in your formats
- Zone GeoTIFF
- Shapefile or GeoPackage of zones
- CSV rate table per zone
- PDF summary
- Dashboard (AgriLens)
WHAT WE NEED FROM YOU
- Field outlines and crop per field
- Soil tests or yield maps, if you have them
- Your target timing for side-dress
WHAT WE PREPARE
- Season record per field
- Zone map and classes
- Guide rates with their source
- Export files for your equipment
Steps and time
- Discovery1–2 weeksZones for one season, compared with your records
- Build2 weeksZone pipeline and exports for your fields
- RunEach seasonZones refreshed before side-dress
 LIVE IN AGRILENSYield forecasts with reasonsA forecast per field, with a range and the factors behind it
 LIVE IN AGRILENSClimate outlookTemperature and rainfall scenarios to 2100 for your area
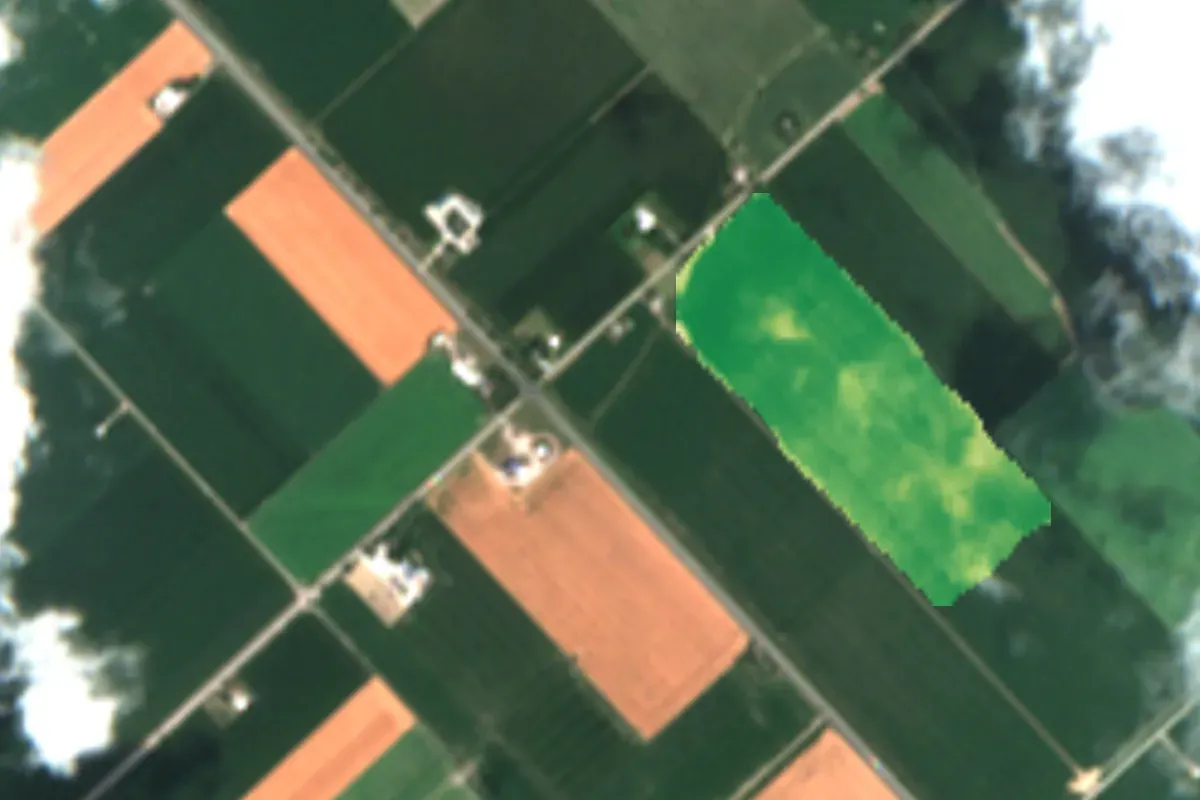 Contains modified Copernicus Sentinel data 2026LIVE IN AGRILENSCrop health mapsWhere each field grows well or falls behind, after every clear pass
DISCUSS THIS SOLUTION
Tell us about your area
We reply with a first view on whether this fits, and what discovery would cover.