
Crop type mapping
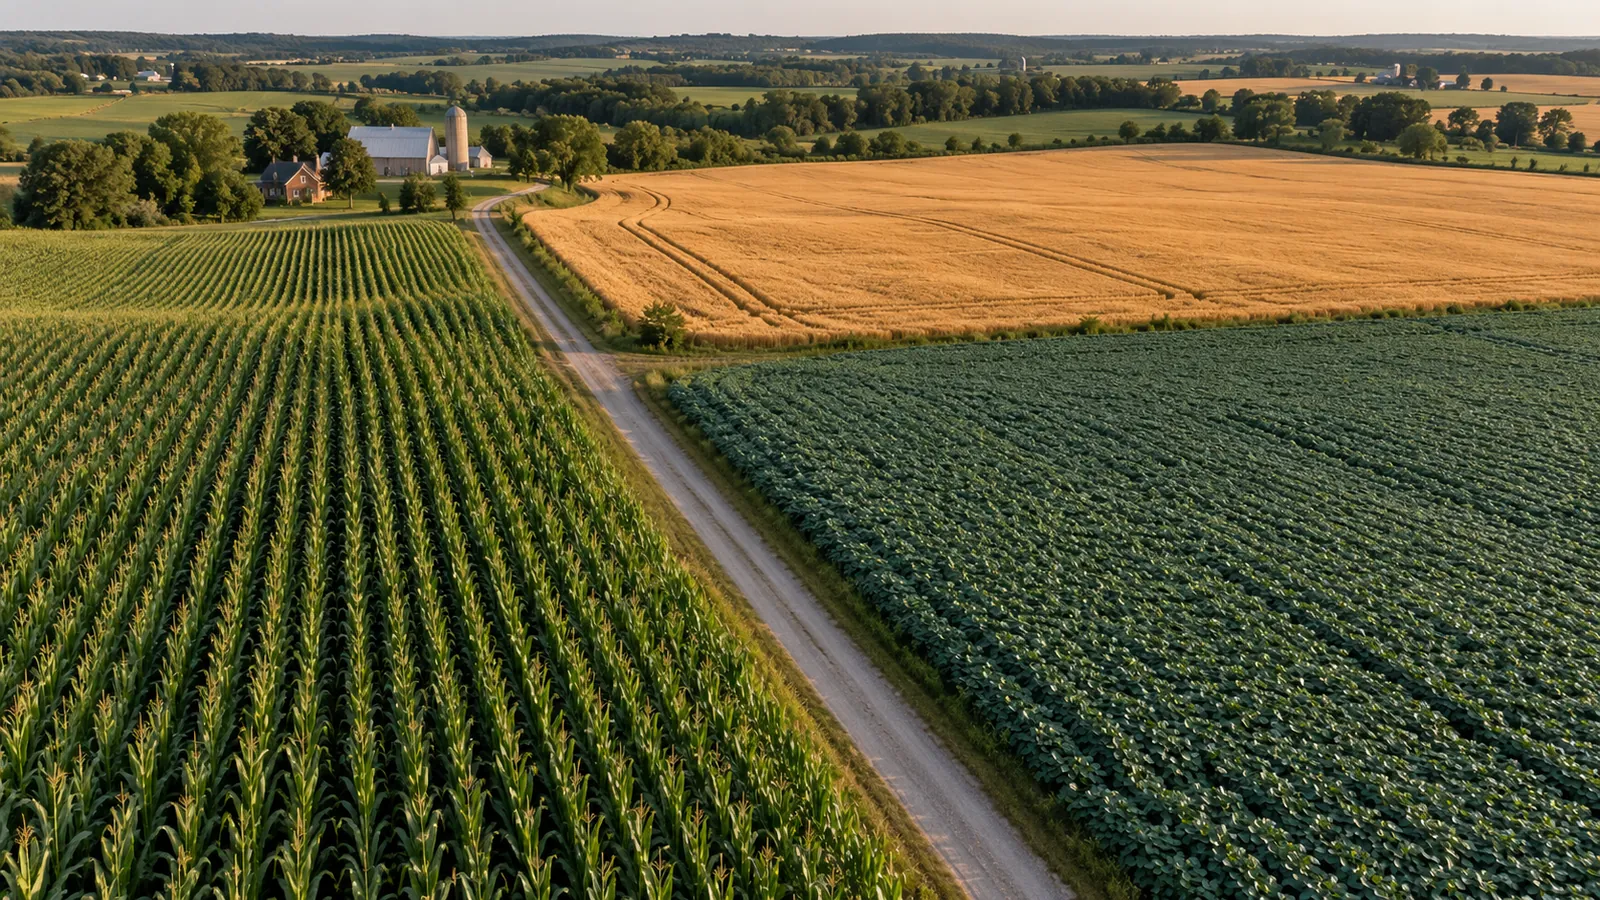
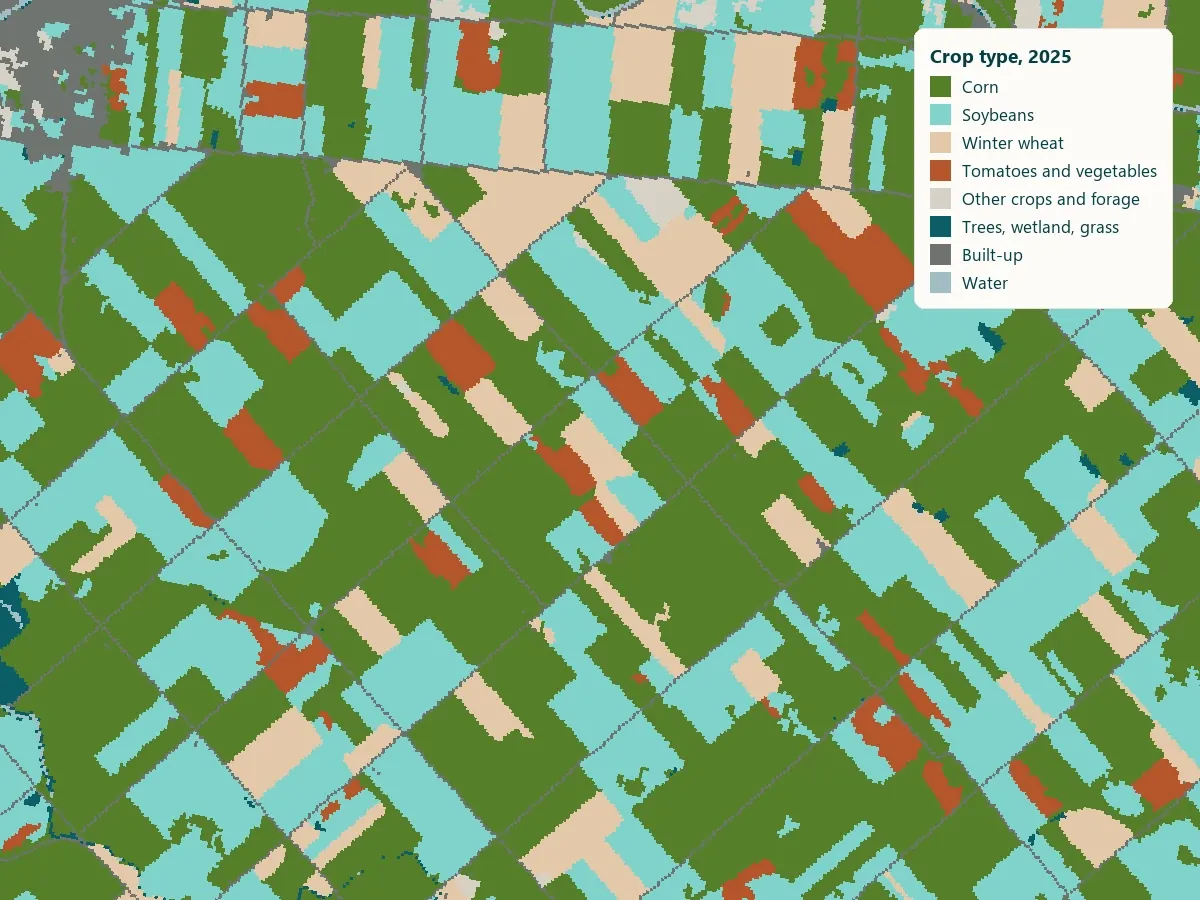
Which crop grows where, accuracy reported per crop.
- DATA
- Sentinel-2 season record
- OUTPUTS
- Crop map, per-crop accuracy, GIS layers
- TYPICAL TIME
- 3–4 weeks
What you can do with it
- 01Know the crop mix in a region or a sourcing area
- 02Check declared crops against the satellite record
- 03Feed the right crop into yield and risk models
- 04Track rotations year over year
METHOD
How it is made
Every number names its data and its limits.
- DATA USED
- Sentinel-2 passes through the season; your known crops, or public crop inventories, as training labels.
- METHOD OR MODEL
- A classifier trained on the seasonal pattern of each field, applied field by field. Accuracy is reported per crop, from fields held out of training.
- ACCURACY AS MEASURED
- Measured on your data during discovery: we compare the result against any ground records you hold before anything is delivered.
- WHAT THIS DOES NOT TELL YOU
- Crops with similar seasons can be confused, and a cloudy season lowers accuracy. Each crop’s accuracy is reported, not an average.
- LANGUAGES
- English and French
WHAT YOU RECEIVE
Maps and data in your formats
- Crop map GeoTIFF
- GeoPackage per field
- Accuracy table (CSV)
- PDF report
WHAT WE NEED FROM YOU
- Your region and season
- Known crops for some fields, for training and checking
- The crops that matter to you
WHAT WE PREPARE
- Season record per field
- Training and held-out testing
- Per-crop accuracy table
- Map, layers and report
Steps and time
- Discovery3–4 weeksCrop map for one season, accuracy per crop
- Build2–3 weeksRepeatable pipeline for your regions
- RunEach seasonMap refreshed mid-season and at harvest
DISCUSS THIS SOLUTION
Tell us about your area
We reply with a first view on whether this fits, and what discovery would cover.