
Urban tree canopy and heat
Where shade is missing and surfaces run hot.
- DATA
- Landsat 8/9 thermal, Sentinel-2
- OUTPUTS
- Heat and canopy maps, neighbourhood table
- TYPICAL TIME
- 3–4 weeks
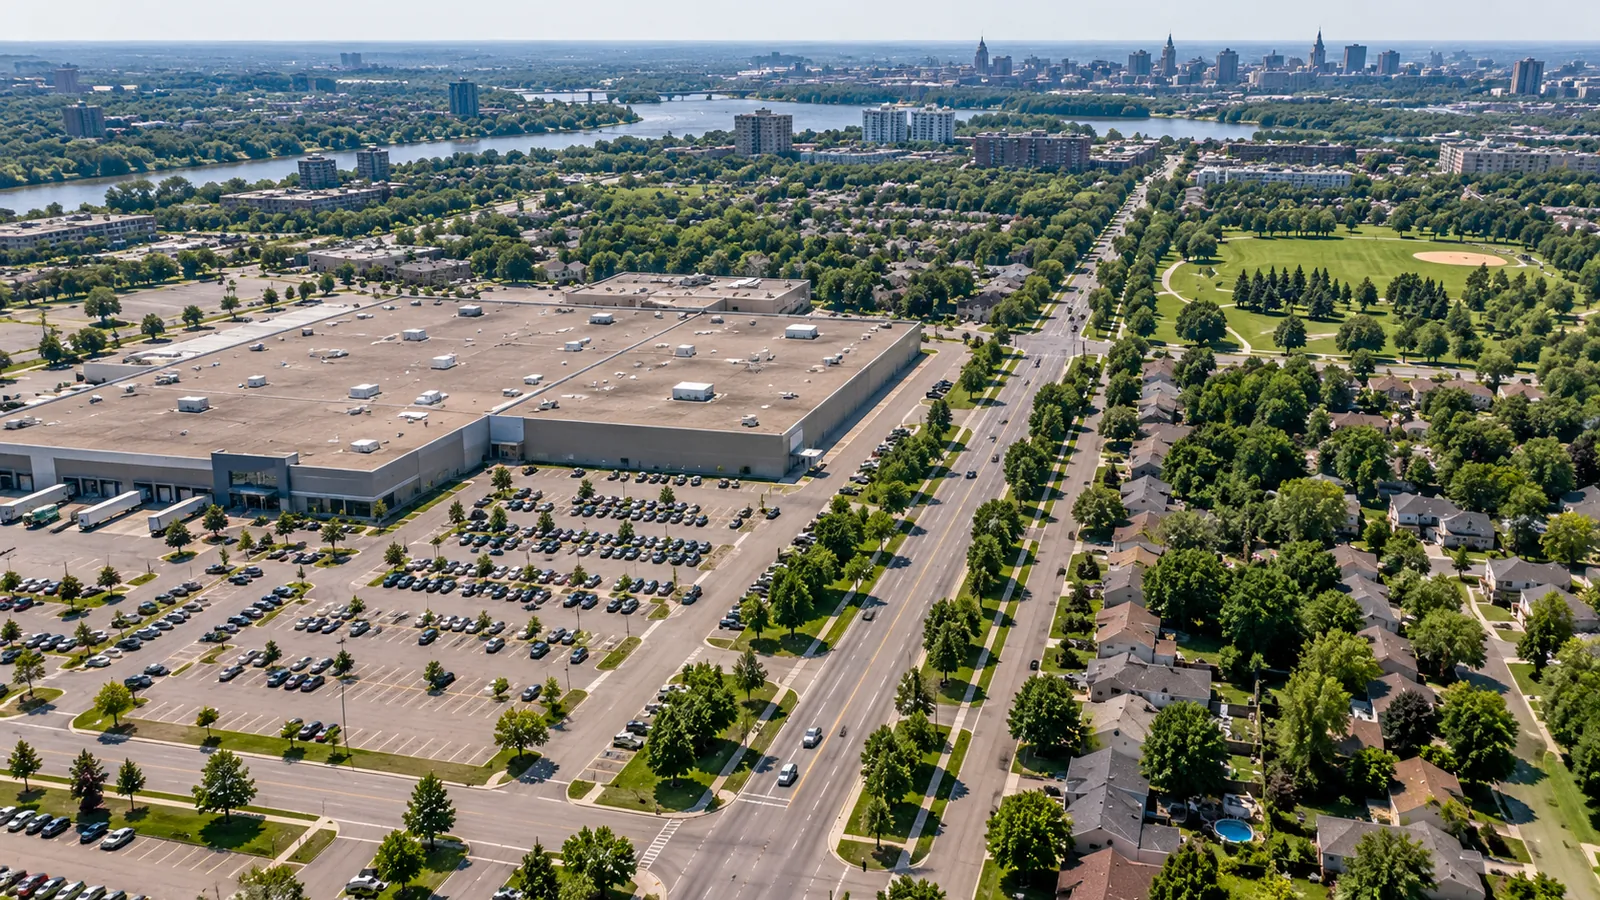
What you can do with it
- 01See which neighbourhoods run hottest on summer days
- 02See where tree canopy is thin
- 03Set priorities for planting and cooling measures
- 04Report heat exposure by ward or neighbourhood
METHOD
How it is made
Every number names its data and its limits.
- DATA USED
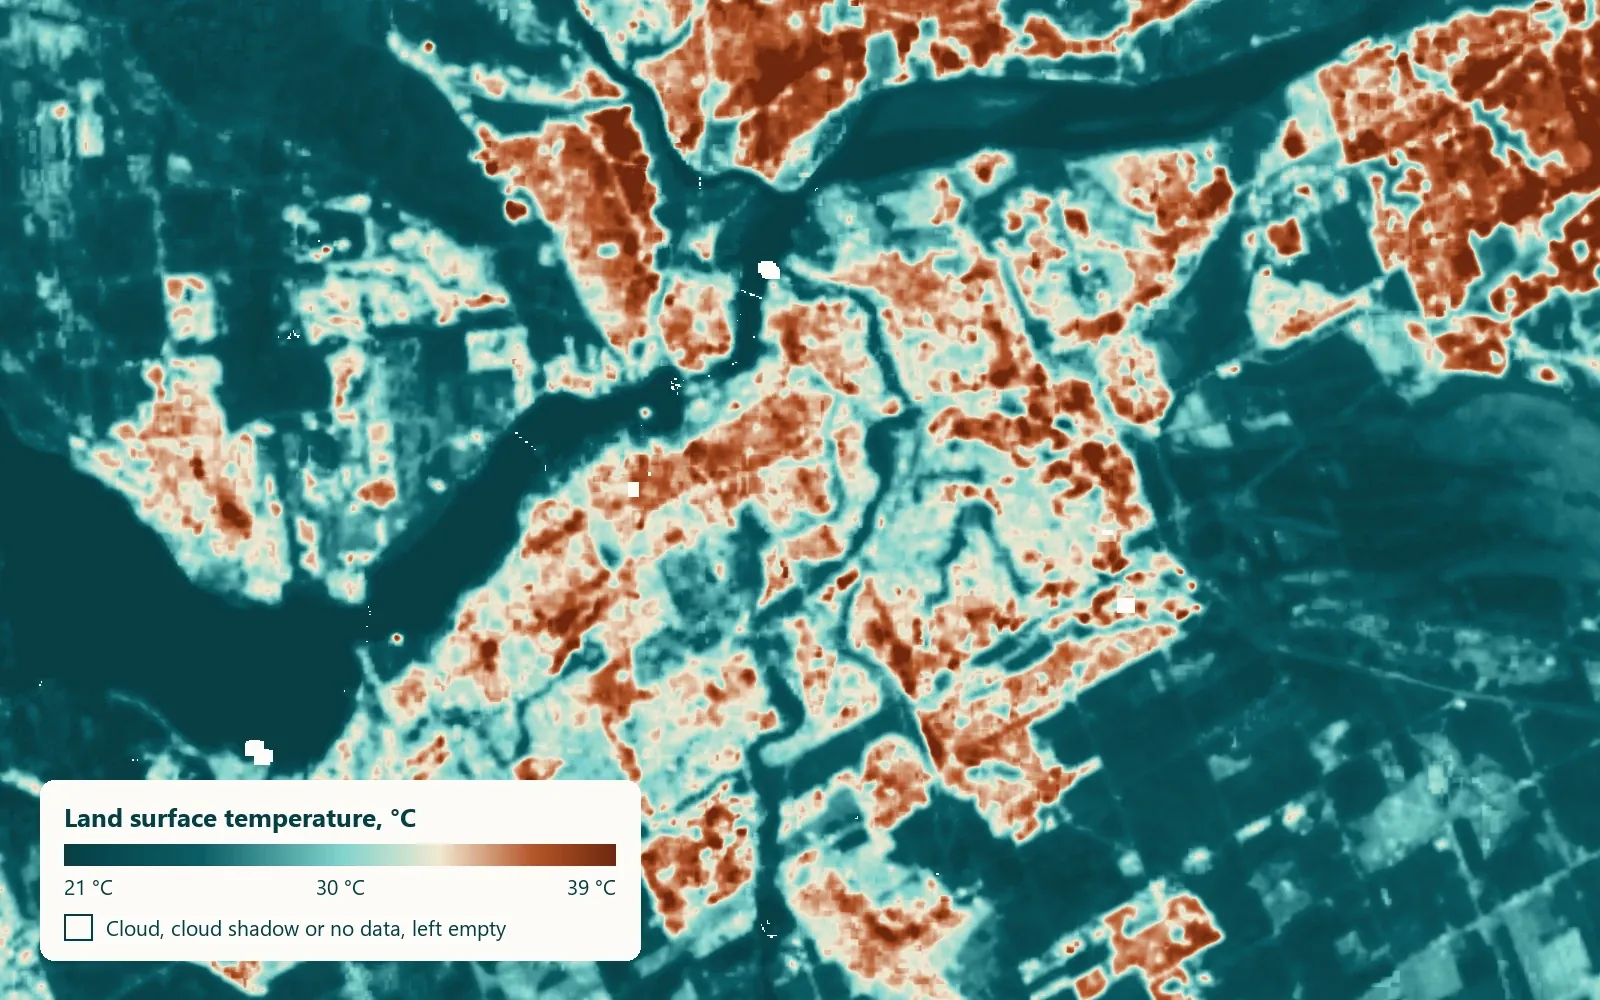
- Landsat 8 and 9 thermal band for surface temperature on clear summer days; Sentinel-2 for canopy and vegetation cover.
- METHOD OR MODEL
- Surface temperature per 30 m pixel, averaged over several clear days; canopy from vegetation indices. Both summarised by neighbourhood.
- ACCURACY AS MEASURED
- Measured on your data during discovery: we compare the result against any ground records you hold before anything is delivered.
- WHAT THIS DOES NOT TELL YOU
- This is surface temperature, not air temperature. Roofs and pavement read hotter than the air above them; shaded streets read cooler.
- LANGUAGES
- English and French
WHAT YOU RECEIVE
Maps and data in your formats
- Heat GeoTIFF
- Canopy GeoTIFF
- GeoPackage by neighbourhood
- PDF report
WHAT WE NEED FROM YOU
- Your city and neighbourhood boundaries
- Any tree inventory you hold
- The decisions the map should support
WHAT WE PREPARE
- Clear-day selection
- Heat and canopy maps
- Neighbourhood summaries
- Report and layers
Steps and time
- Discovery3–4 weeksOne summer mapped for one city
- Build2 weeksRepeatable pipeline
- RunYearlyUpdated after each summer
DISCUSS THIS SOLUTION
Tell us about your area
We reply with a first view on whether this fits, and what discovery would cover.