
Drought monitoring
Vegetation and moisture against normal, by region.
- DATA
- Sentinel-2, Open-Meteo, SoilGrids
- OUTPUTS
- Anomaly maps, regional index, report
- TYPICAL TIME
- Monthly through the season
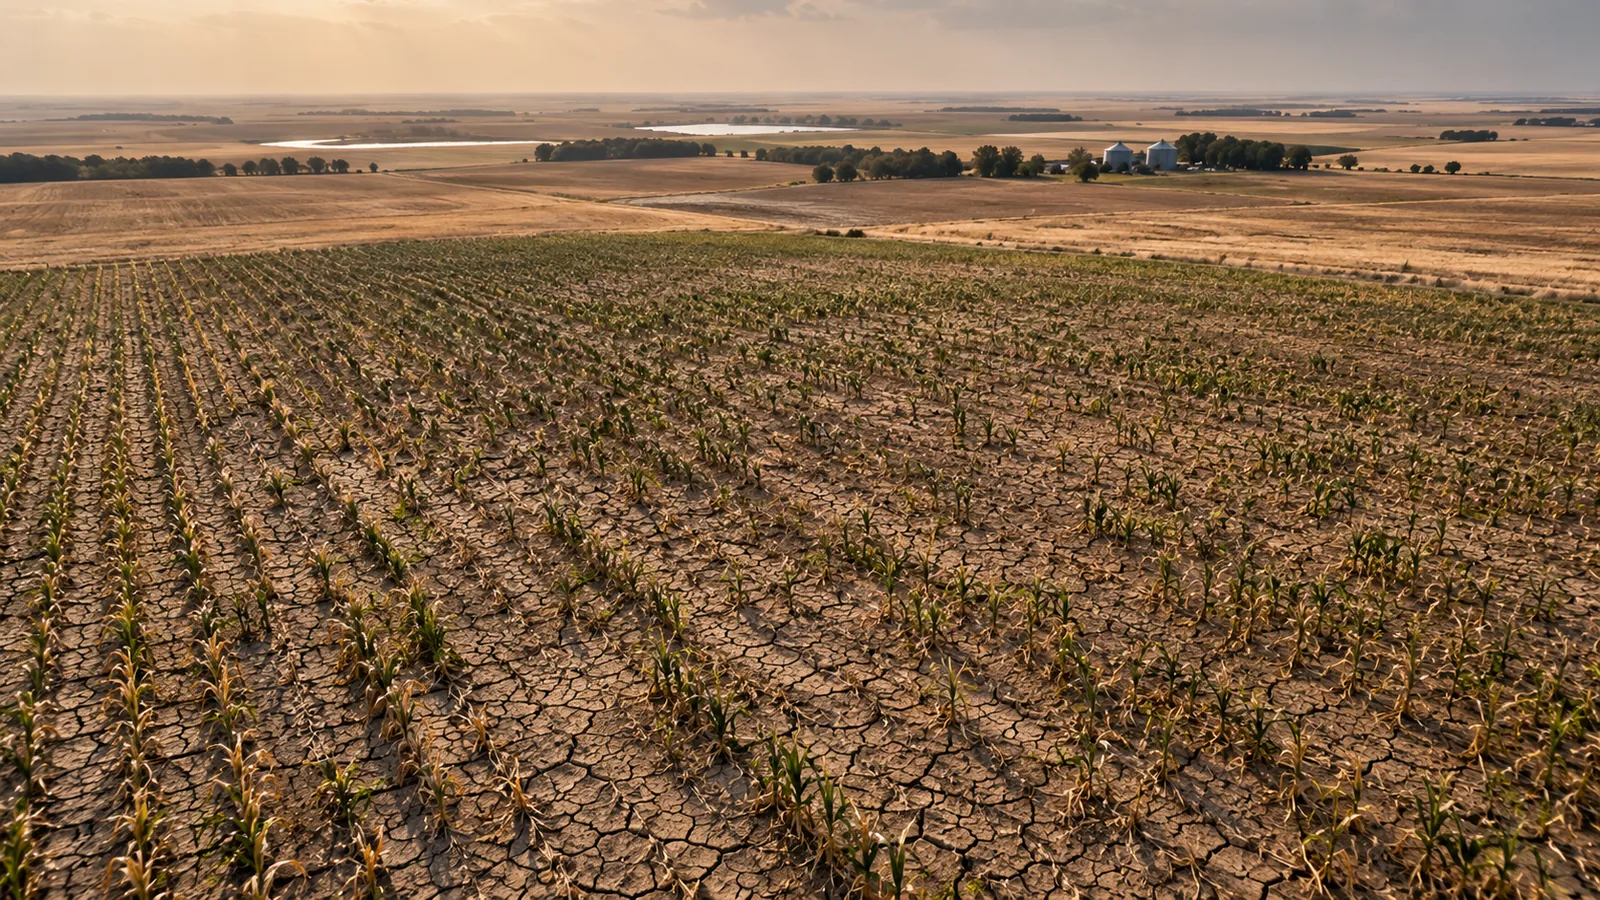
What you can do with it
- 01See which regions are drier than normal, and for how long
- 02Separate a dry spell from a long-term trend
- 03Brief a board, a council or a lender with one map
- 04Trigger field checks or relief where the anomaly persists
METHOD
How it is made
Every number names its data and its limits.
- DATA USED
- Vegetation index from Sentinel-2 compared with the same weeks in earlier years; rainfall and soil-moisture estimates from Open-Meteo; soil water capacity from SoilGrids.
- METHOD OR MODEL
- Anomaly against a multi-year baseline per pixel, aggregated to fields, watersheds or municipalities. Severity classes defined with you during discovery.
- ACCURACY AS MEASURED
- Measured on your data during discovery: we compare the index against any ground records you hold (yields, moisture probes, reports).
- WHAT THIS DOES NOT TELL YOU
- Satellite vegetation lags the weather by days to weeks, and irrigated land hides drought. Cloudy periods leave gaps, which are shown as gaps.
- LANGUAGES
- English and French
WHAT YOU RECEIVE
Maps and data in your formats
- Monthly anomaly GeoTIFF
- GeoPackage by region
- CSV regional index
- PDF briefing
- Dashboard on request
WHAT WE NEED FROM YOU
- Your regions or boundaries
- Any ground records: yields, moisture probes, past drought declarations
- The decisions the map should support
WHAT WE PREPARE
- Multi-year baseline for your area
- Monthly anomaly maps
- Severity classes agreed with you
- Briefing and layers
Steps and time
- Discovery3–4 weeksBaseline built, one past drought year reviewed with you
- Build2–3 weeksMonthly pipeline and briefing template
- RunEach seasonMonthly maps and a season summary
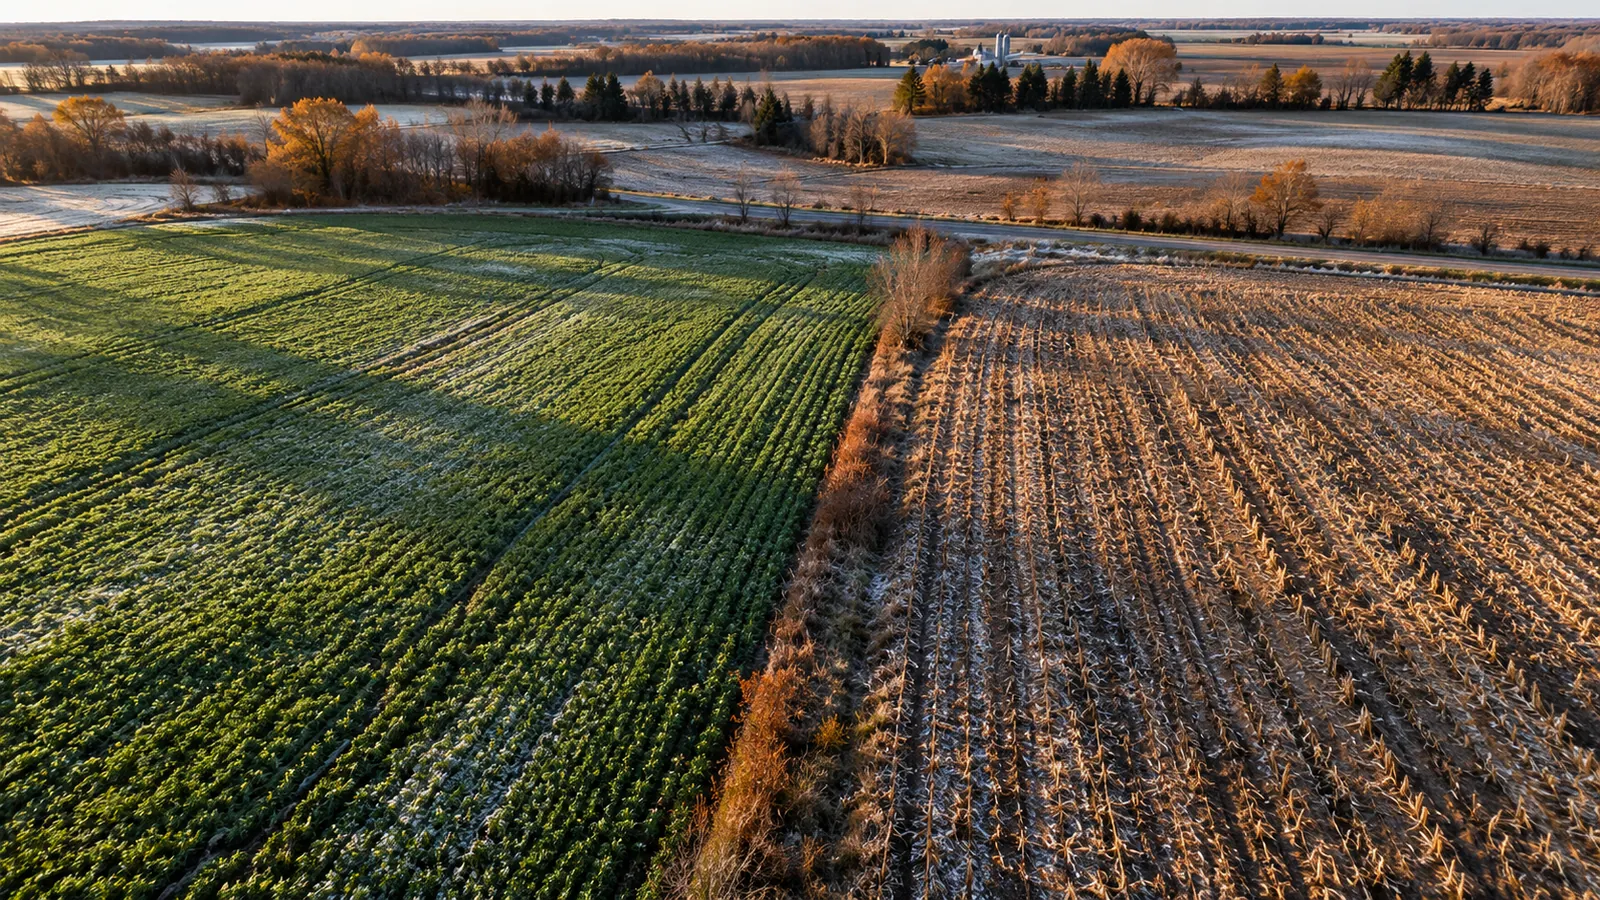 ON REQUESTCover crop and tillage monitoringPractices seen from space across a sourcing region
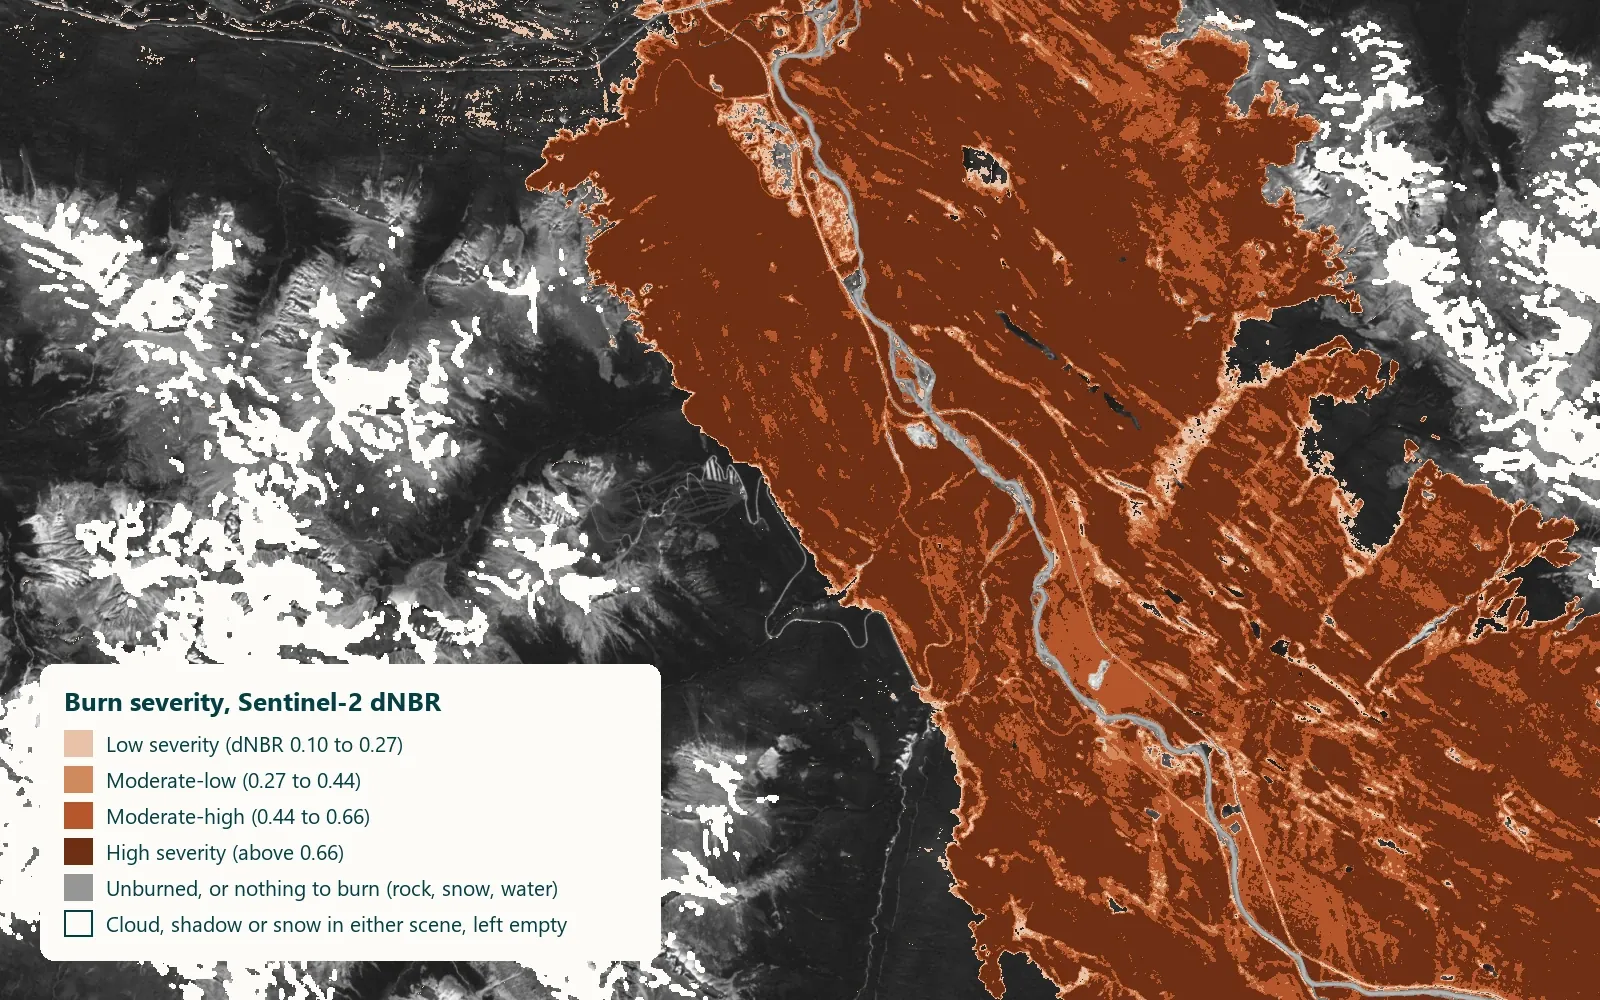 Contains modified Copernicus Sentinel data 2024ON REQUESTWildfire exposure and burn scarsPast fires, burned area and recovery near your assets
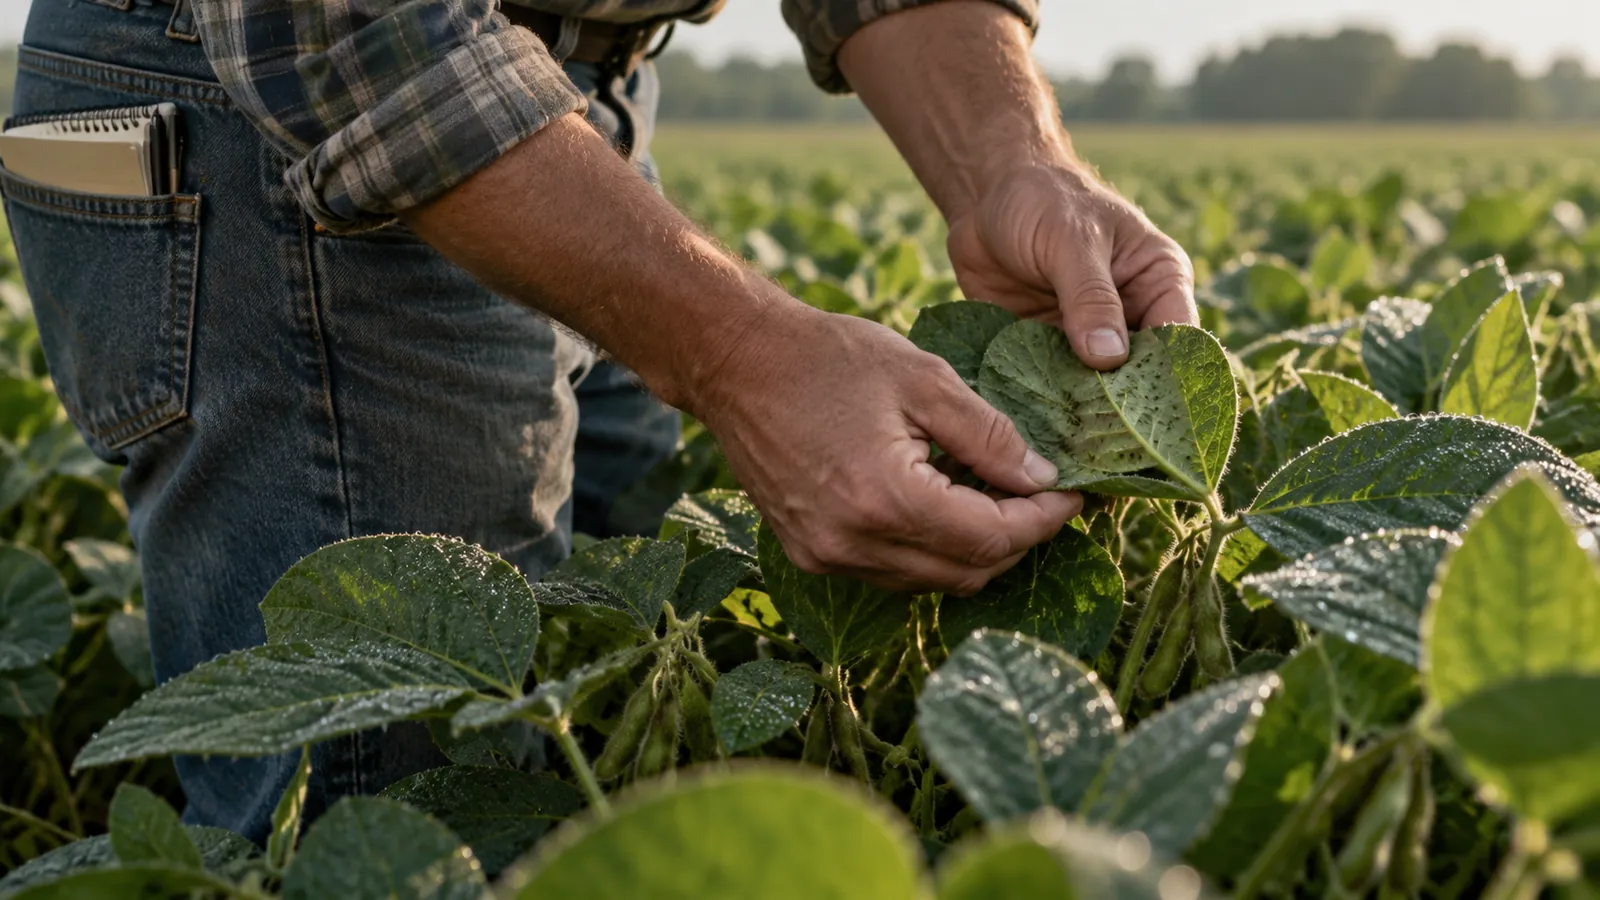 ON REQUESTPest and disease riskWeather-based risk levels that say when to scout
DISCUSS THIS SOLUTION
Tell us about your area
We reply with a first view on whether this fits, and what discovery would cover.