
Climate outlook
Temperature and rainfall scenarios to 2100 for your area.
- DATA
- CanDCS-U6 projections
- OUTPUTS
- Charts, tables, short report
- TYPICAL TIME
- 1–2 weeks
What you can do with it
- 01See how growing-season heat and rainfall in your area are projected to change
- 02Compare two or three emissions scenarios side by side
- 03Put a long-term number behind a planning or lending decision
- 04Brief a board or council in one chart
METHOD
How it is made
Every number names its data and its limits.
- DATA USED
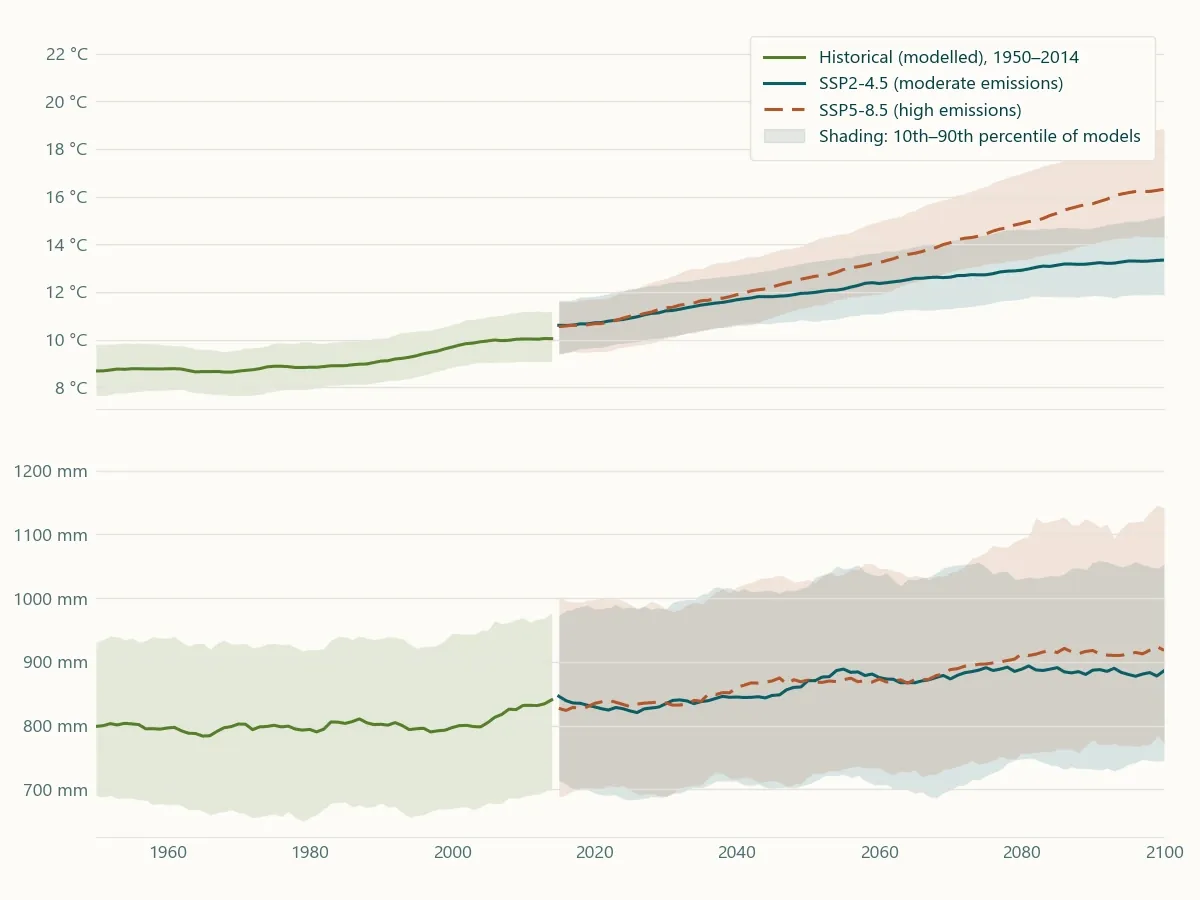
- CanDCS-U6 statistically downscaled climate projections for Canada, taken for the grid cells over your area.
- METHOD OR MODEL
- Projections summarised per decade and per scenario: growing degree days, heat days, frost-free season, seasonal rainfall. Ranges across models are shown, not hidden.
- ACCURACY AS MEASURED
- Projections are scenarios, not forecasts. We report the spread across models and the historical baseline so you can judge them.
- WHAT THIS DOES NOT TELL YOU
- A projection says what the climate models agree on for a region. It does not predict any one year, and it does not resolve a single field.
- LANGUAGES
- English and French
WHAT YOU RECEIVE
Maps and data in your formats
- PDF report
- CSV per decade and scenario
- Charts as PNG and SVG
- Dashboard (AgriLens)
WHAT WE NEED FROM YOU
- Your area of interest
- The variables that matter to your decision
- Your planning horizon
WHAT WE PREPARE
- Grid selection and baseline
- Per-decade summaries for each scenario
- Charts and the report
Steps and time
- Discovery1–2 weeksOutlook for your area, three scenarios
- Build1–2 weeksRepeatable outlook for several areas
- RunYearlyRefresh when projections are updated
DISCUSS THIS SOLUTION
Tell us about your area
We reply with a first view on whether this fits, and what discovery would cover.