APPROACH
Fromorbittoreport
Five steps from a raw satellite pass to a report you can act on, shown on the AgriLens demo farm. Further down: how engagements run, the tools we use, and common questions.
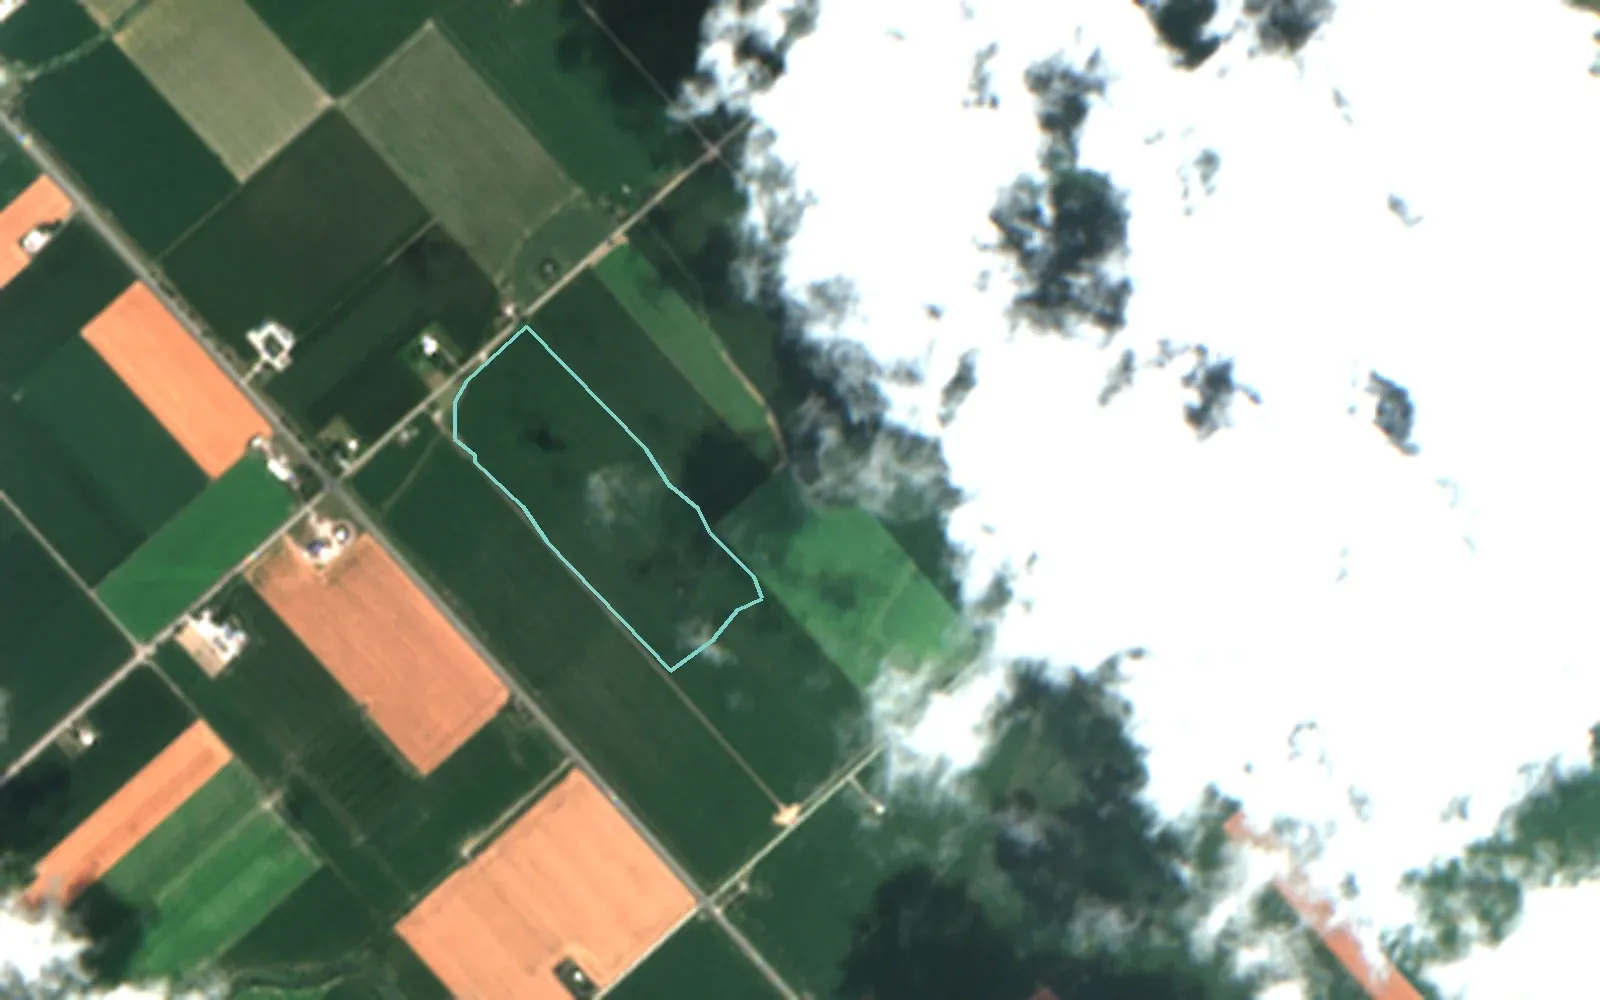
One field on the AgriLens demo farm, Chatham-Kent, Ontario, 22 July 2026: raw Sentinel-2 true colour, 4.0 × 2.5 km, with clouds and their shadows east of the field (field outlined). · Contains modified Copernicus Sentinel data 2026
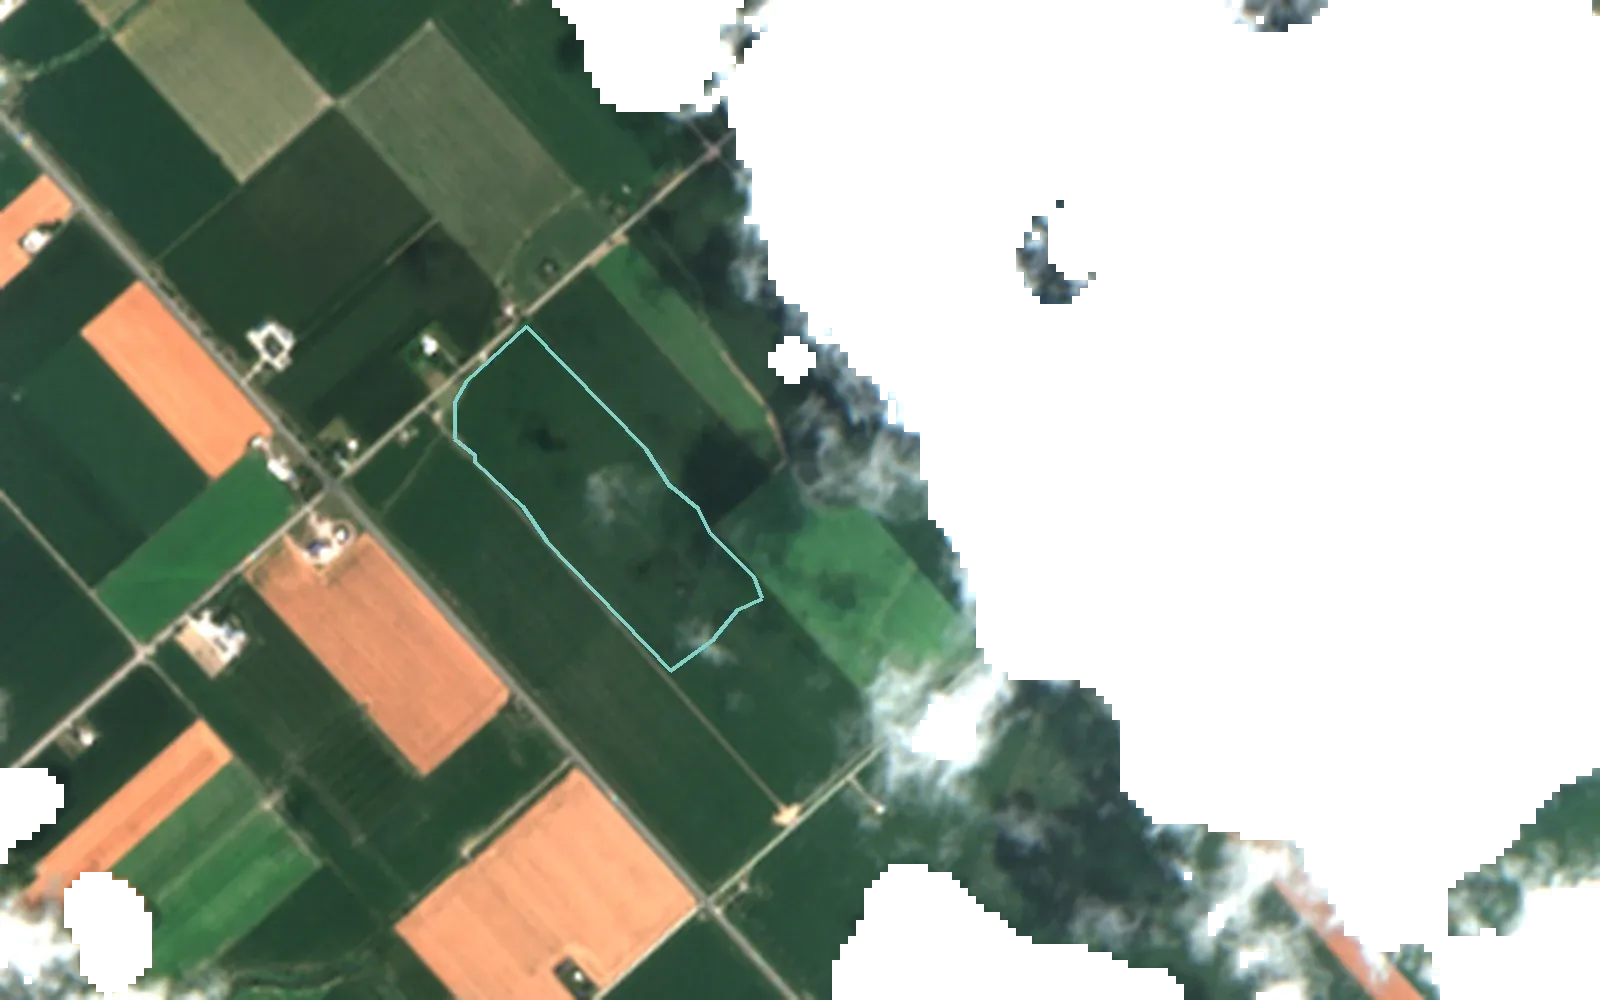
Same scene, 22 July 2026, after the AgriLens cloud and shadow mask: masked pixels are left empty. The field itself is 100% clear. · Contains modified Copernicus Sentinel data 2026
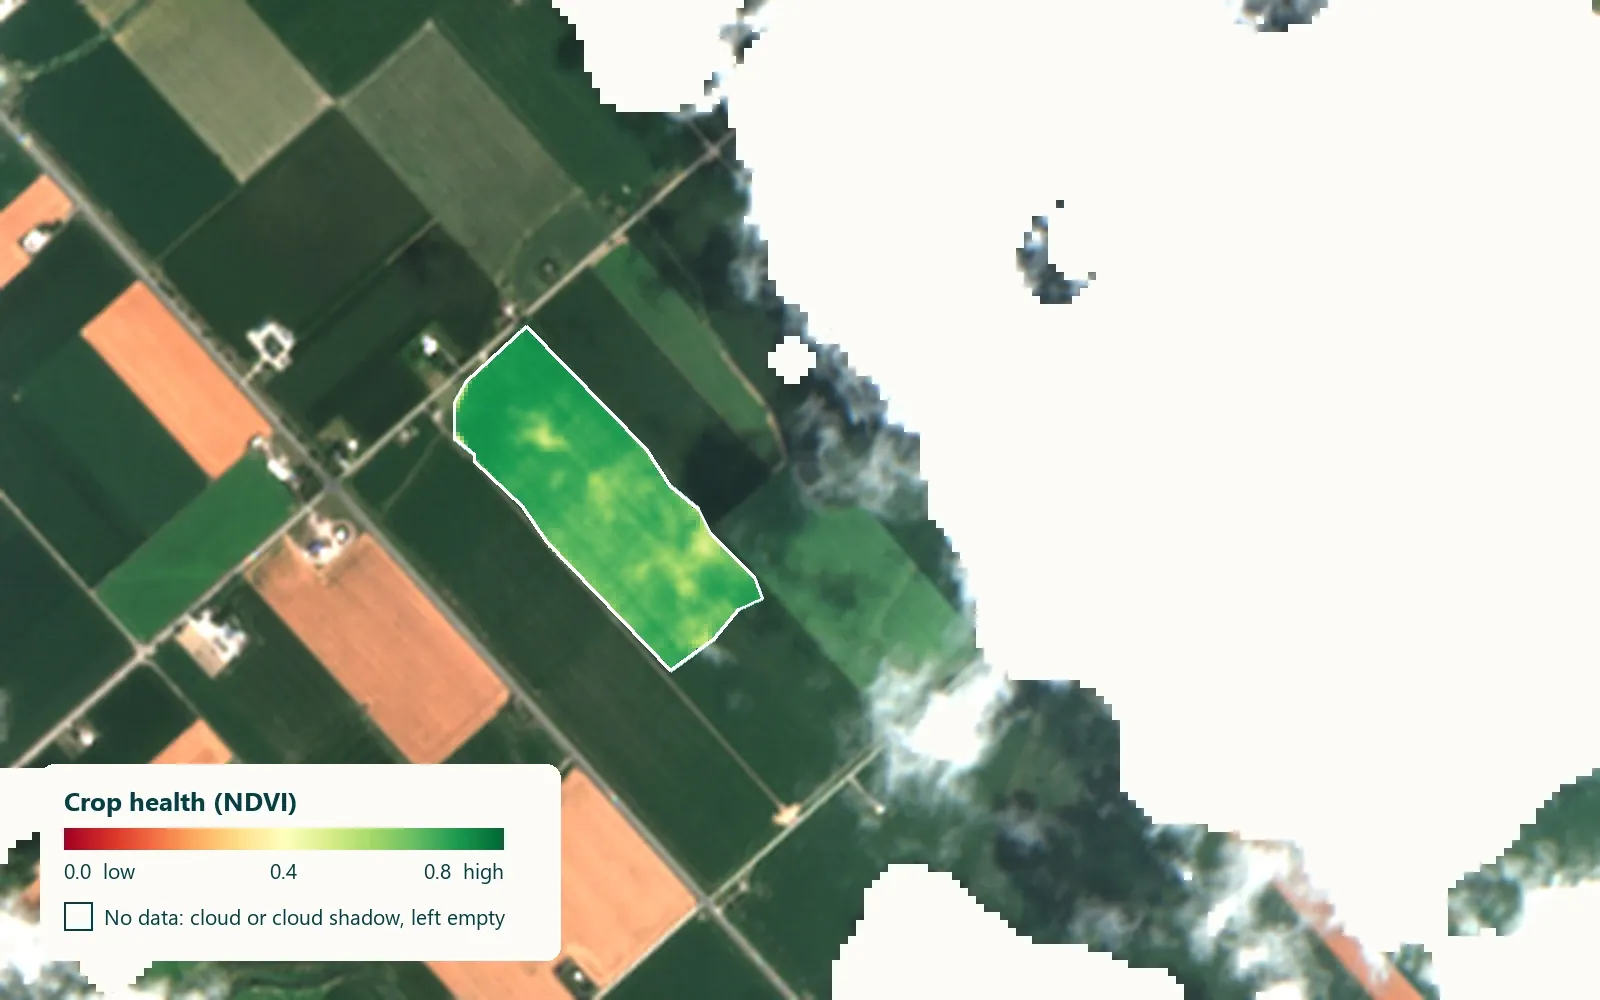
Crop-health (NDVI) map of one field, 22 July 2026, from 0 (low) to 0.8 (high); cloud and shadow left empty. · Contains modified Copernicus Sentinel data 2026
Yield forecast for one field, 9.3 t/ha (90% interval 4.9 to 10.6 t/ha), and the factors that raised or lowered it, in t/ha. Forecast made 19 August 2026.
AgriLens field report for one field: 3 of 5 sections grounded in their sources, the rest marked not available. Real in-app report.
01 / 05 · COLLECT
Every satellite pass, clouds and all
Sentinel-2 passes over southern Ontario every few days. We gather every scene for your area and season, together with weather and soil data.
One field on the AgriLens demo farm, Chatham-Kent, Ontario, 22 July 2026: raw Sentinel-2 true colour, 4.0 × 2.5 km, with clouds and their shadows east of the field (field outlined). · Contains modified Copernicus Sentinel data 2026
02 / 05 · PREPARE
Clouds masked, gaps left empty
Cloud and shadow pixels are removed. We do not fill them with guesses: a gap is shown as a gap, so you always know what was actually seen.
Same scene, 22 July 2026, after the AgriLens cloud and shadow mask: masked pixels are left empty. The field itself is 100% clear. · Contains modified Copernicus Sentinel data 2026
03 / 05 · PREDICT
Crop health, field by field
Each clear pixel gets a crop-health value. Models trained on past Ontario seasons turn the season’s pattern into a yield forecast with a range.
Crop-health (NDVI) map of one field, 22 July 2026, from 0 (low) to 0.8 (high); cloud and shadow left empty. · Contains modified Copernicus Sentinel data 2026
04 / 05 · EXPLAIN
Every forecast shows its reasons
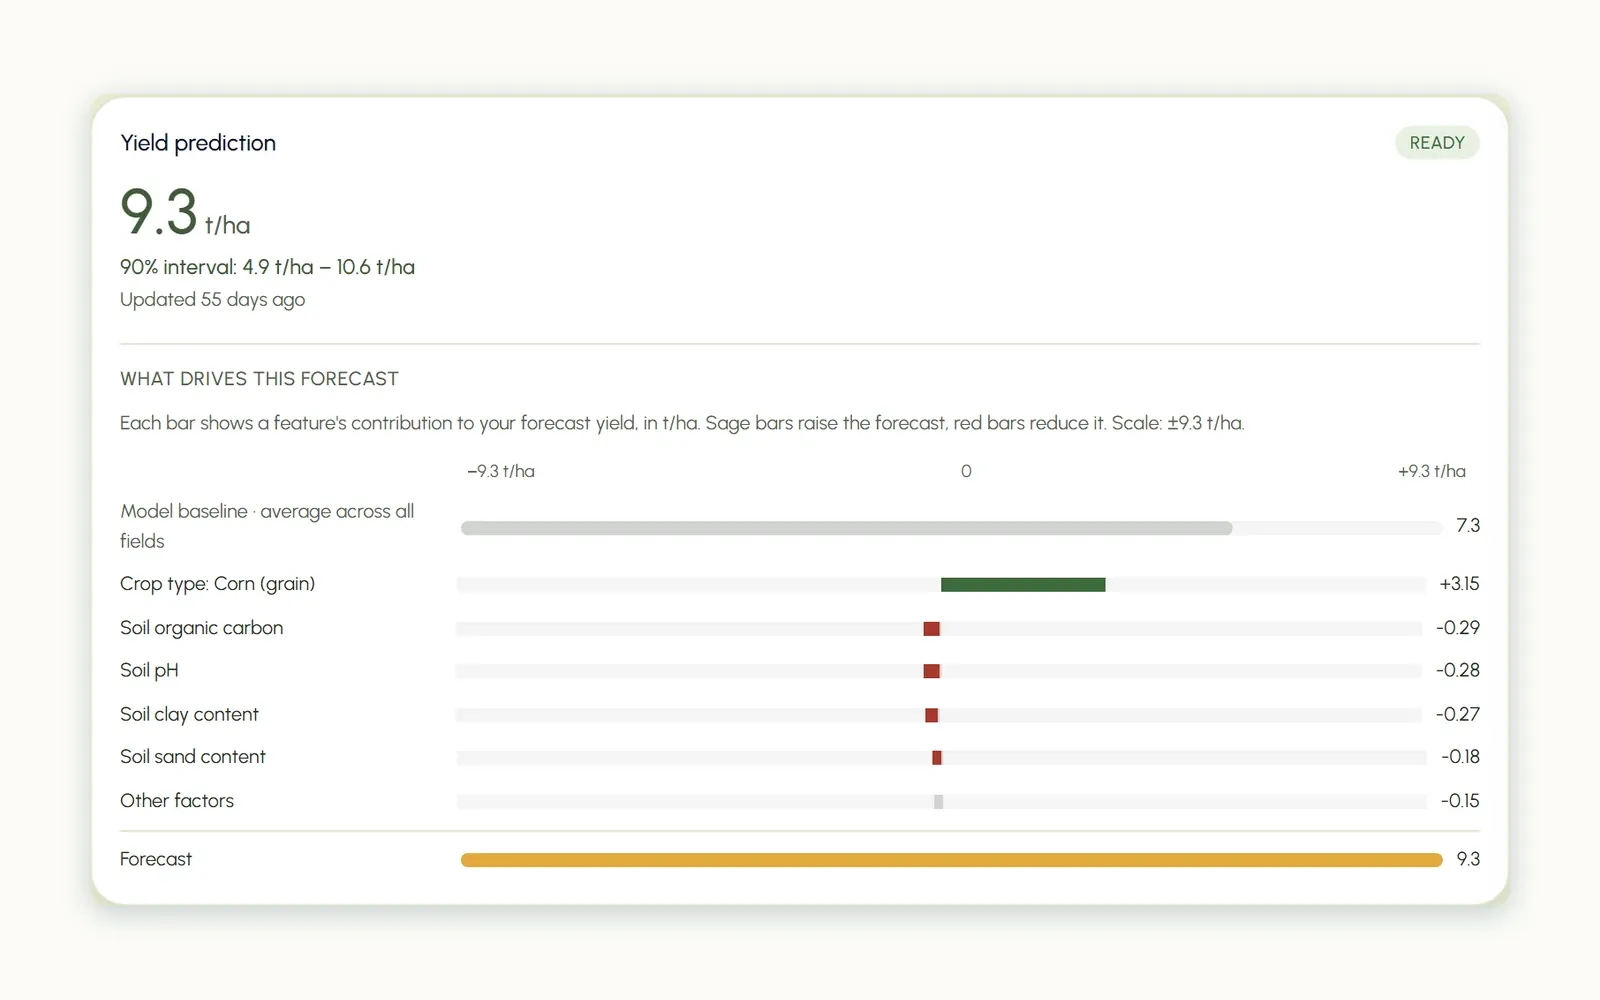
The forecast lists what raised or lowered it, in tonnes per hectare. On one field, corn as the crop type raises the forecast by 3.15 t/ha.
Yield forecast for one field, 9.3 t/ha (90% interval 4.9 to 10.6 t/ha), and the factors that raised or lowered it, in t/ha. Forecast made 19 August 2026.
05 / 05 · DELIVER
Maps, a report and GIS layers
Findings in plain language with the maps behind them, and layers your team can open in its own GIS tools.
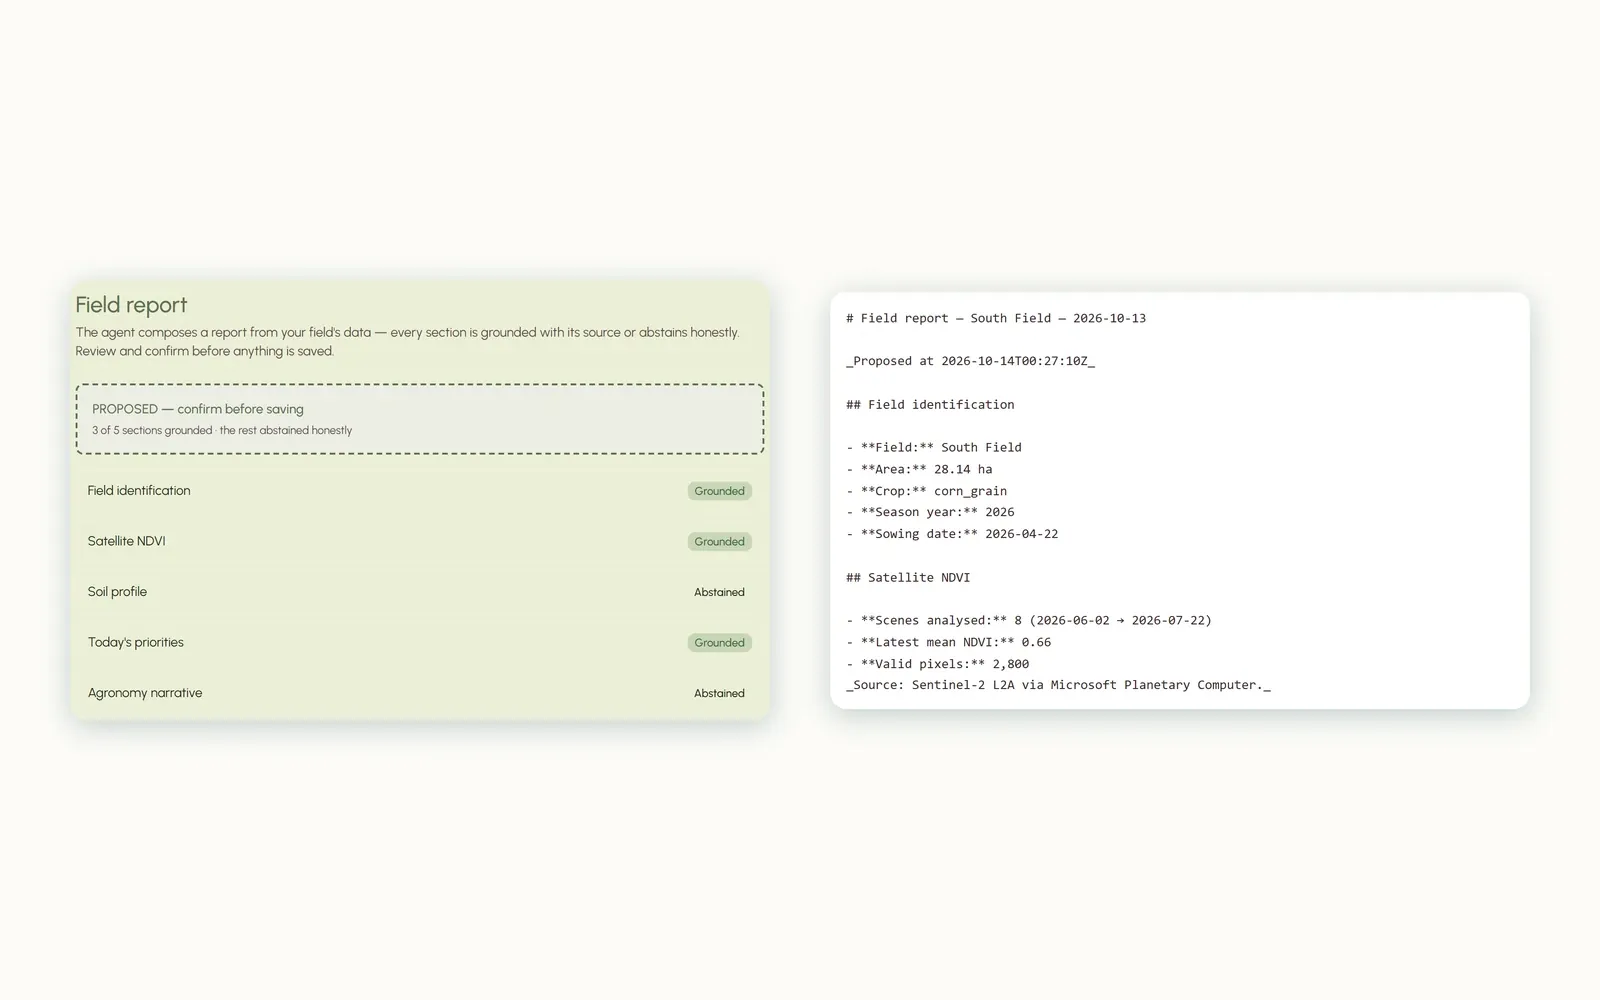
AgriLens field report for one field: 3 of 5 sections grounded in their sources, the rest marked not available. Real in-app report.
ENGAGEMENT MODELS
Start small, then build and run
Each stage has its own scope and price. You can stop after any of them.
- 012–4 WEEKS · FIXED SCOPE · AI STRATEGY AND READINESSDiscoveryWe test one idea on your data and tell you plainly whether it works, what it would cost, and what could go wrong.YOU GET · A working pilot or a clear no, with costs and risks
- 02IDEA TO PRODUCTIONBuildWe build the pipeline, model or assistant, with tests and documentation, and your team involved from the start.YOU GET · Code, infrastructure and documentation in your repositories
- 03MONITORING AND SUPPORTRunWe watch quality and cost, retrain when the data shifts, and support your team after launch.YOU GET · Monitoring, alerts and regular reviews
For satellite questions about one area, the discovery is an area assessment: maps, a short report and GIS layers in 3–4 weeks. Repeated each season, it becomes monitoring.
TECHNOLOGY STACK
Tools by layer
Tools we use today, and tools we are set up to use. We choose them for your environment, not ours.
- 01DataIN USEPythonSQLPostgreSQLPostGISParquetPandasSQLAlchemyAlembicCeleryRedisOPEN TOSnowflakeMySQLMongoDBS3 and MinIOAzure Blob Storage
- 02ModelsIN USEscikit-learnRandom forest and gradient boostingSHAP explanationsUncertainty rangesMLflowOPEN TOPyTorchFoundation models for Earth observation
- 03AI assistantsIN USERetrieval with citationspgvectorLangGraph and LangChainHosted LLMs (OpenAI, Anthropic, Groq)Evaluation setsEN / FROPEN TOOpen-weight models on your infrastructure
- 04Cloud and DevOpsIN USEAzure Container AppsTerraformGitHub ActionsDockerSentry and uptime monitoringpytest and PlaywrightOPEN TOKubernetes (AKS)Azure FunctionsBicepAzure DevOps PipelinesOn-premise
- 05GeospatialIN USESentinel-2Planetary ComputerGDALRasterioGeoPandasLeafletGIS-ready layersOPEN TOSentinel-1LandsatFields of The World
PRINCIPLES
Three rules for everything we deliver
- Reasons shownEvery forecast lists the factors behind it, so you can check it against what you know.
- Estimates labelledEstimates carry a range and are marked as estimates. Gaps stay empty, not guessed.
- Data sources namedEach map and report states its data, with place, date and sensor. All sources
Questions
How does a project start?
Tell us about your area or your problem through the contact form, then a 2–4 week discovery with a fixed scope and price.
Can this be funded?
Some Canadian programs, such as NRC IRAP, may cover parts of an AI project; we can help you scope it.
Who owns the code and the data?
You do. Everything we build is delivered to your repositories and accounts.
What if satellite data can't answer our question?
We tell you early, before you spend money on a full build.
Do you work in French?
Yes. We work, write and deliver in English and French.
Ready for a 2–4 week discovery?