
Cover crop and tillage monitoring
Practices seen from space across a sourcing region.
- DATA
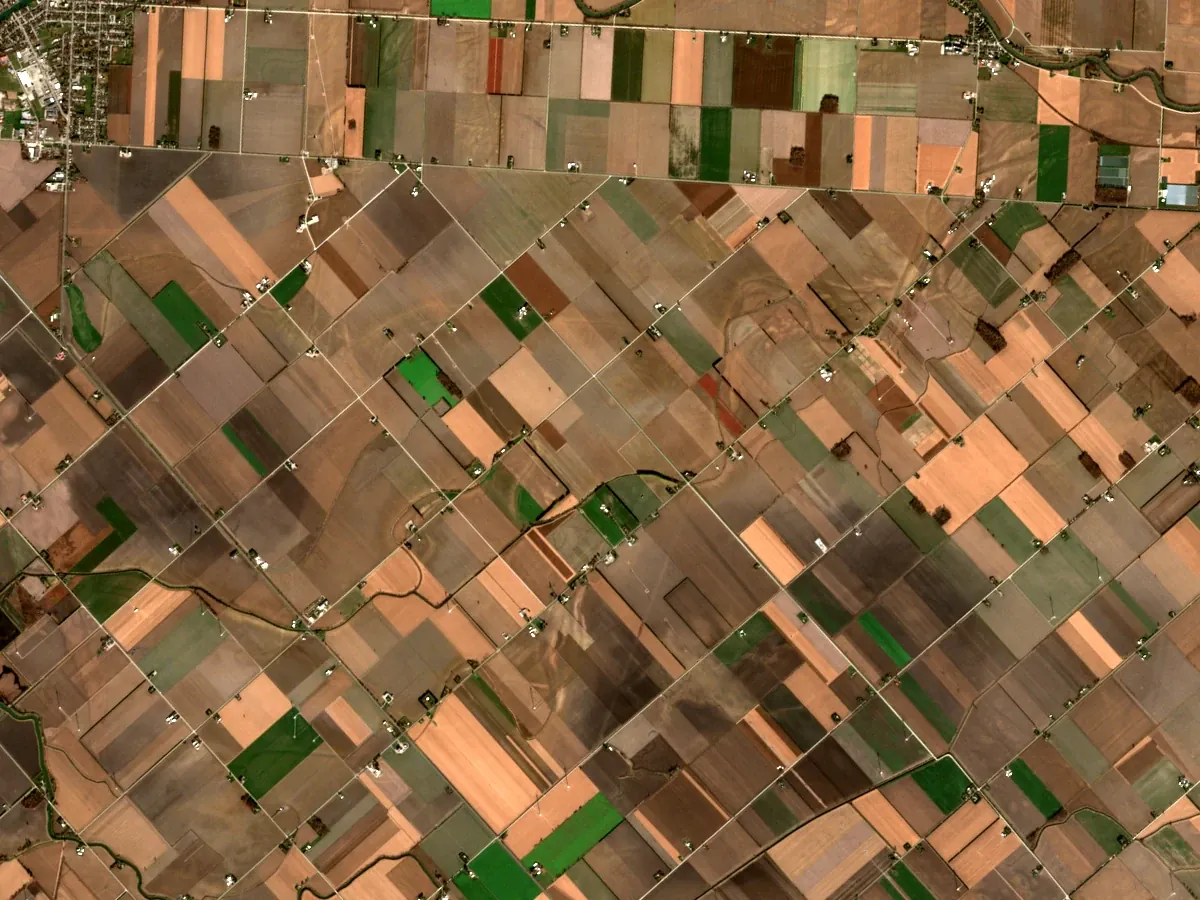
- Sentinel-2 autumn and spring passes
- OUTPUTS
- Practice map, per-field table, report
- TYPICAL TIME
- 3–4 weeks
What you can do with it
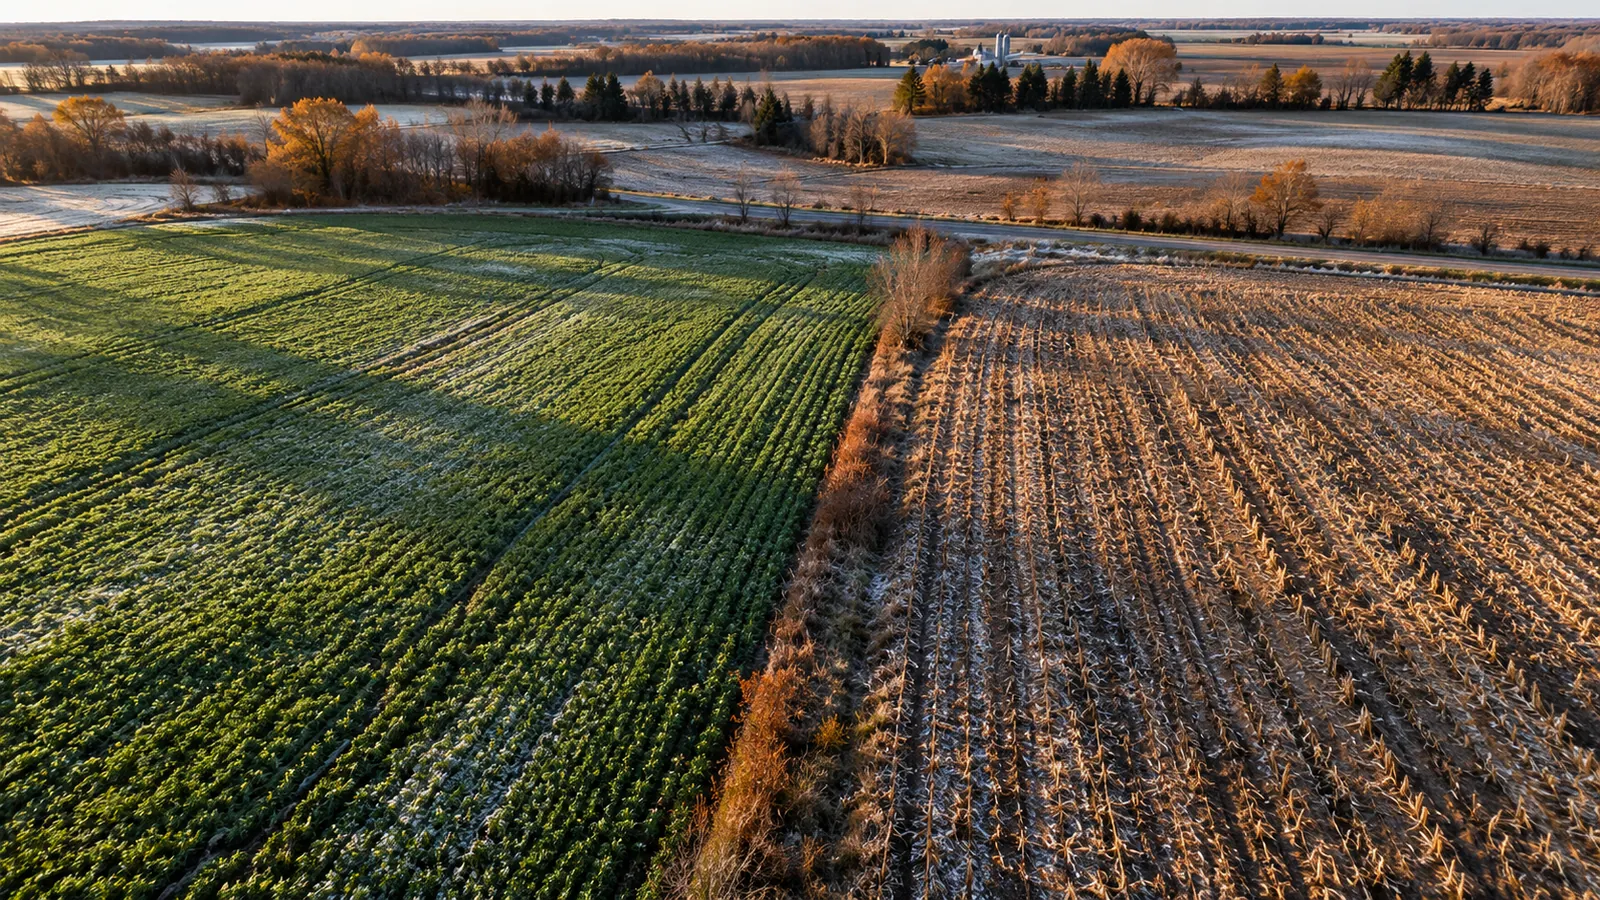
- 01See which fields had a cover crop over winter
- 02See which fields were tilled and when
- 03Report practices across a sourcing region without a site visit
- 04Check supplier claims against the satellite record
METHOD
How it is made
Every number names its data and its limits.
- DATA USED
- Sentinel-2 passes from harvest to spring planting, for every field in the region.
- METHOD OR MODEL
- Green cover and bare-soil indices through autumn and spring, classed per field into cover crop, residue or tilled. Classes are checked against fields you know.
- ACCURACY AS MEASURED
- Measured on your data during discovery: we compare the result against any ground records you hold before anything is delivered.
- WHAT THIS DOES NOT TELL YOU
- Satellite sees cover, not the species or the seeding date. Snow and cloud limit winter passes, and short windows can be missed.
- LANGUAGES
- English and French
WHAT YOU RECEIVE
Maps and data in your formats
- Practice map GeoTIFF
- GeoPackage per field
- CSV table
- PDF report
WHAT WE NEED FROM YOU
- Your region or supplier fields
- Known practices for some fields
- The reporting period
WHAT WE PREPARE
- Autumn-to-spring season record
- Practice classes and checks
- Map, table and report
Steps and time
- Discovery3–4 weeksOne region, one winter, checked against known fields
- Build2–3 weeksRepeatable pipeline for your regions
- RunYearlyReport after each winter
DISCUSS THIS SOLUTION
Tell us about your area
We reply with a first view on whether this fits, and what discovery would cover.