
CASE STUDY · AGRILENS
CropintelligenceforOntariofarms
We designed and built AgriLens end to end: satellite pipeline, models, explanations, assistant and app. It is where our methods run in the open, on a 141.5 ha demo farm.
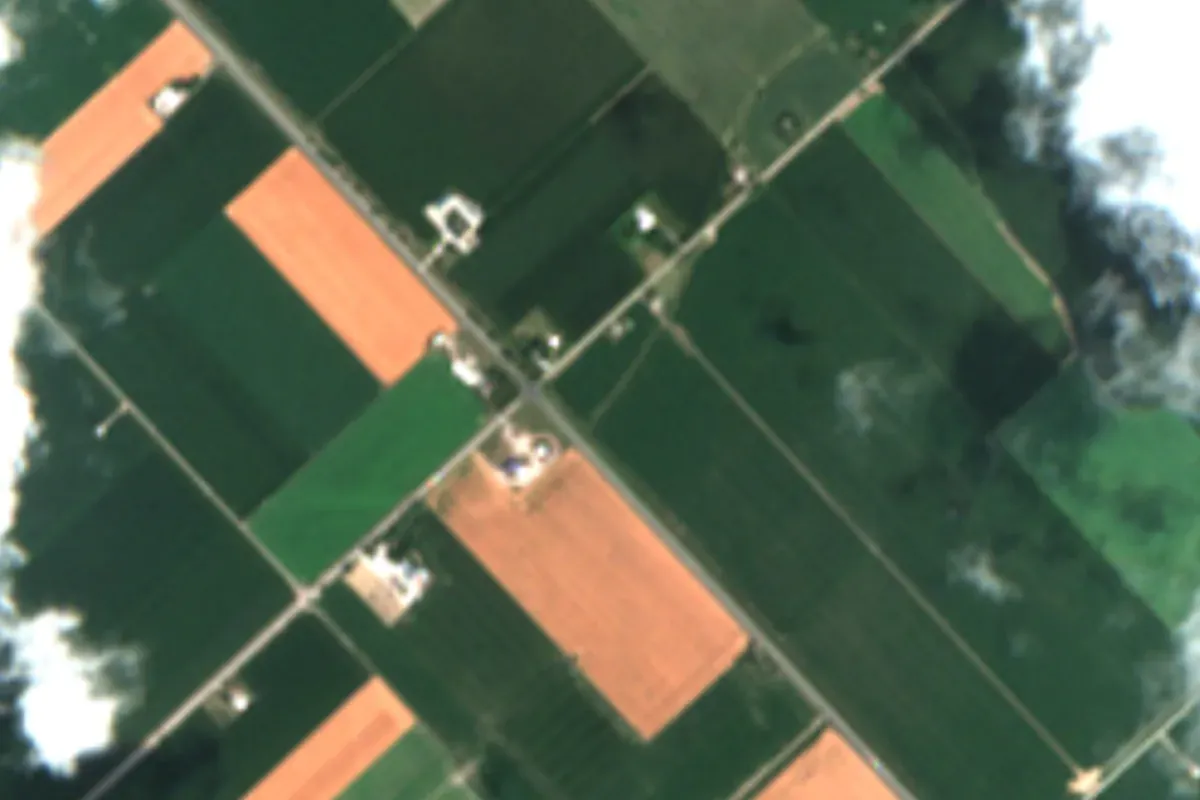
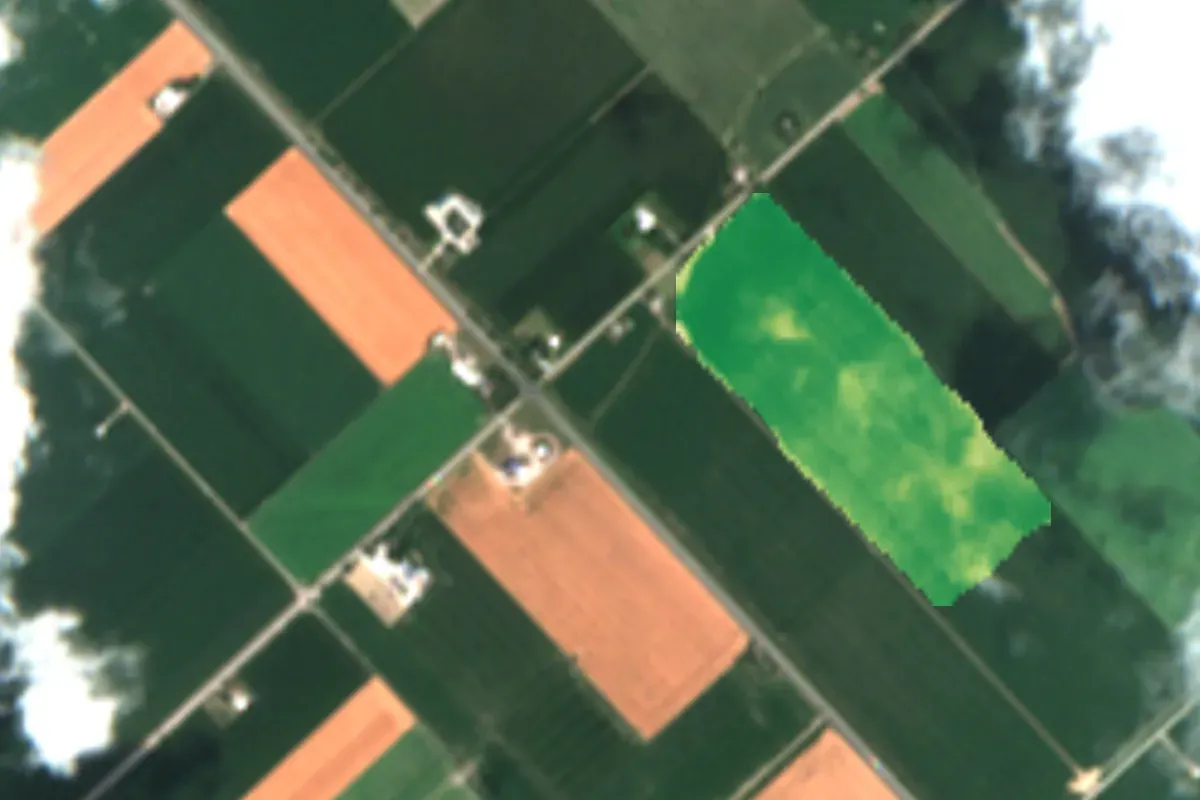
THE PROBLEM
Images, but no answers
Ontario growers and agronomists can get satellite images of their fields. What they rarely get is an answer they can act on, and check. In our April 2026 review of 14 crop platforms, none explained individual forecasts.
We built the whole chain ourselves, using all five services: plan, see, predict, ask, run. Every number shows its reasons and its source.
The product tour
1 min 33 s, from the farm map to one field’s forecast.
PRODUCT TOUR · 1:33 · APEX INTELLIGENCESome screens show Esri World Imagery © Esri, Maxar, Earthstar Geographics
WHAT WE BUILT · SIX LIVE FEATURES
What we built
- 01 · LIVE
Farm and field maps
Every field on one satellite map, with crop health inside each field after each clear pass.
141.5 HA · 4 FIELDS · SENTINEL-2, JUN–SEP 2026
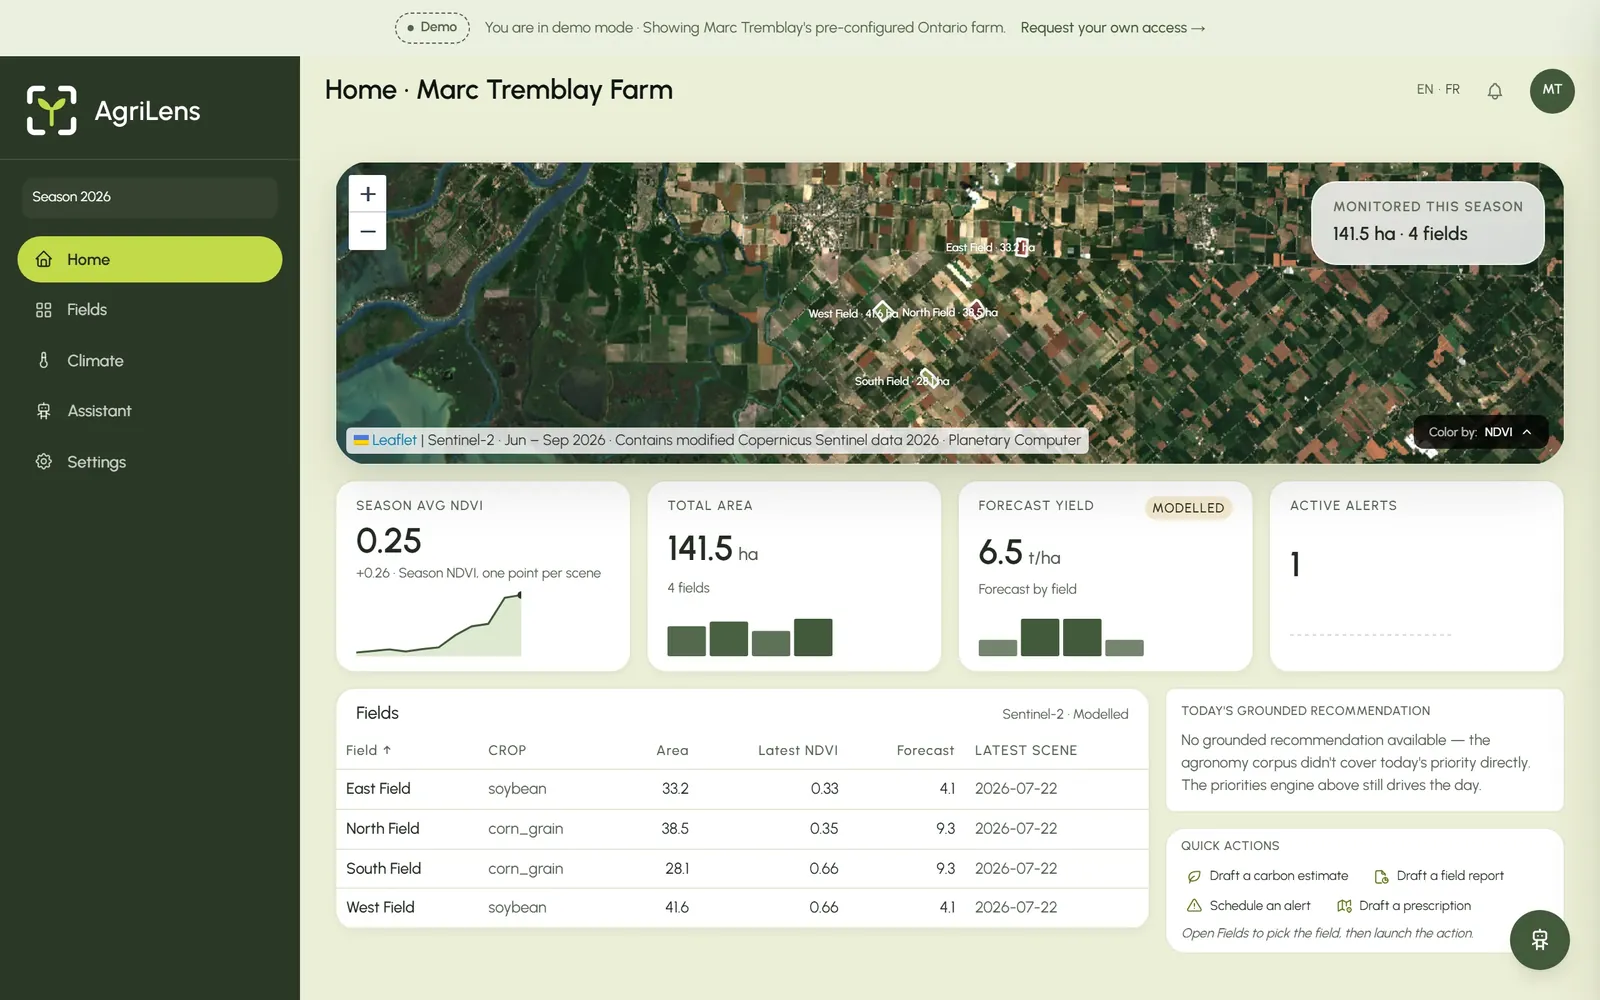
AgriLens home dashboard, demo farm · AgriLens screen, Apex Intelligence · Contains modified Copernicus Sentinel data 2026
- 02 · LIVE
Fields on the season basemap
The four fields of the demo farm on the Sentinel-2 season mosaic, with the field list, crop and latest crop-health value.
MARC TREMBLAY DEMO FARM · 141.5 HA · CHATHAM-KENT
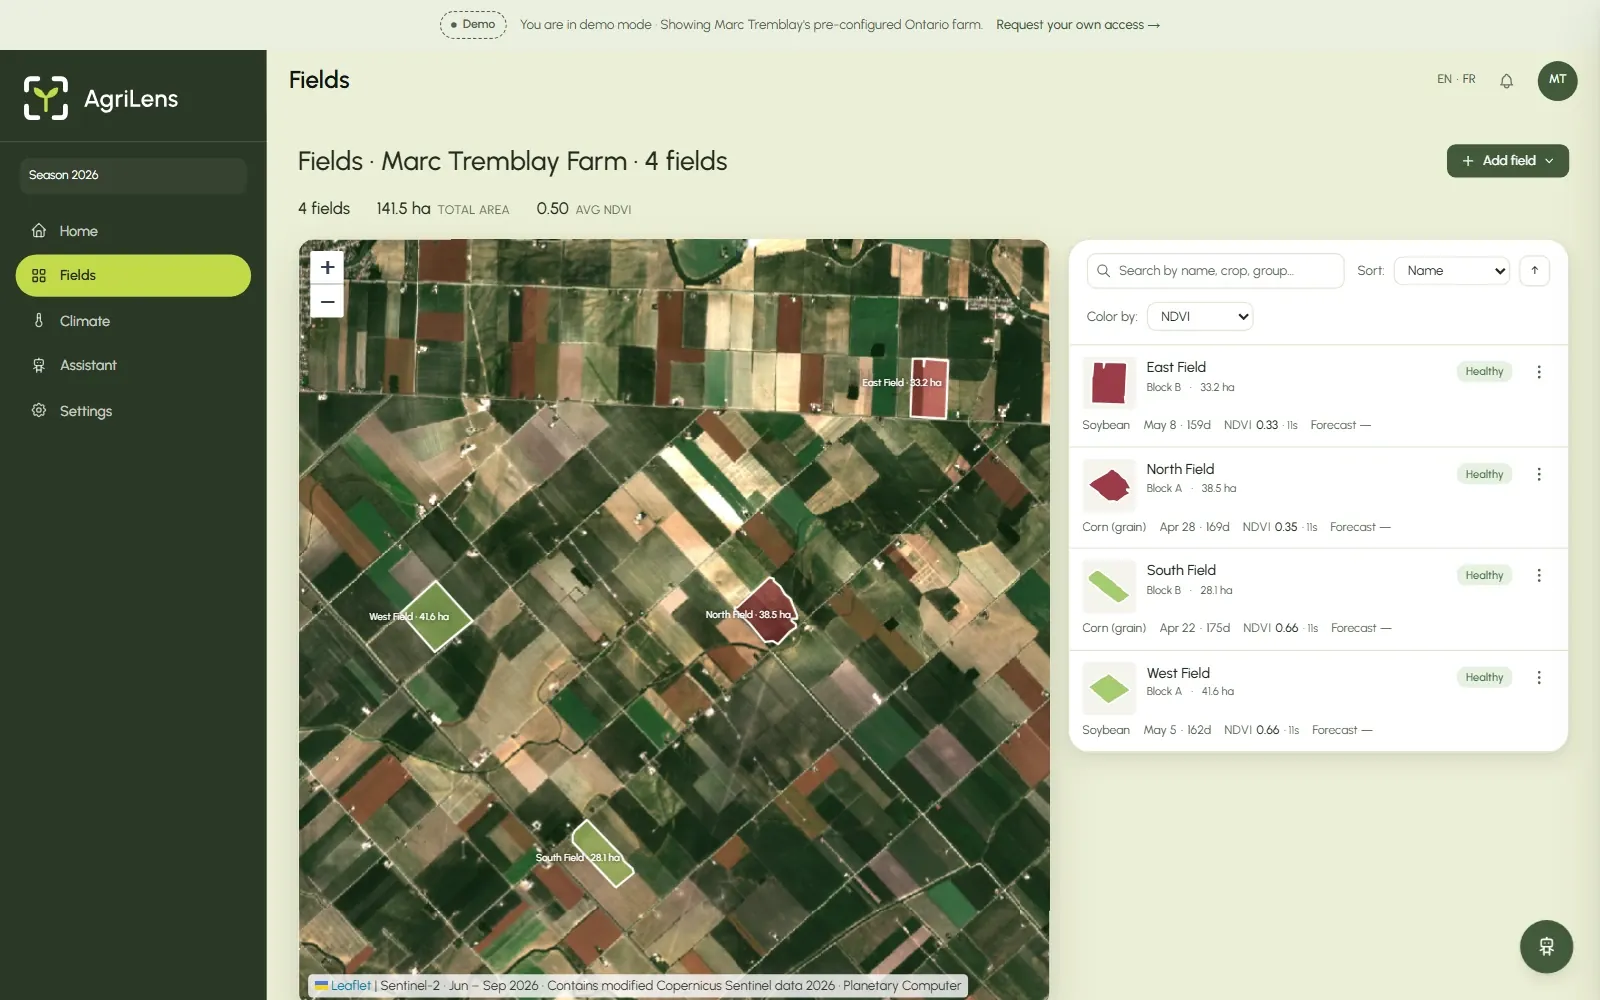
AgriLens Fields page, Marc Tremblay demo farm, Chatham-Kent, Ontario: the four fields (141.5 ha) on the Sentinel-2 season basemap, with the field list. · AgriLens screen, Apex Intelligence · Contains modified Copernicus Sentinel data 2026
- 03 · LIVE
Satellite viewer and time series
Crop health inside one field after each clear pass, and how it moved since sowing.
SOUTH FIELD · LATEST NDVI 0.66 · 22 JUL 2026
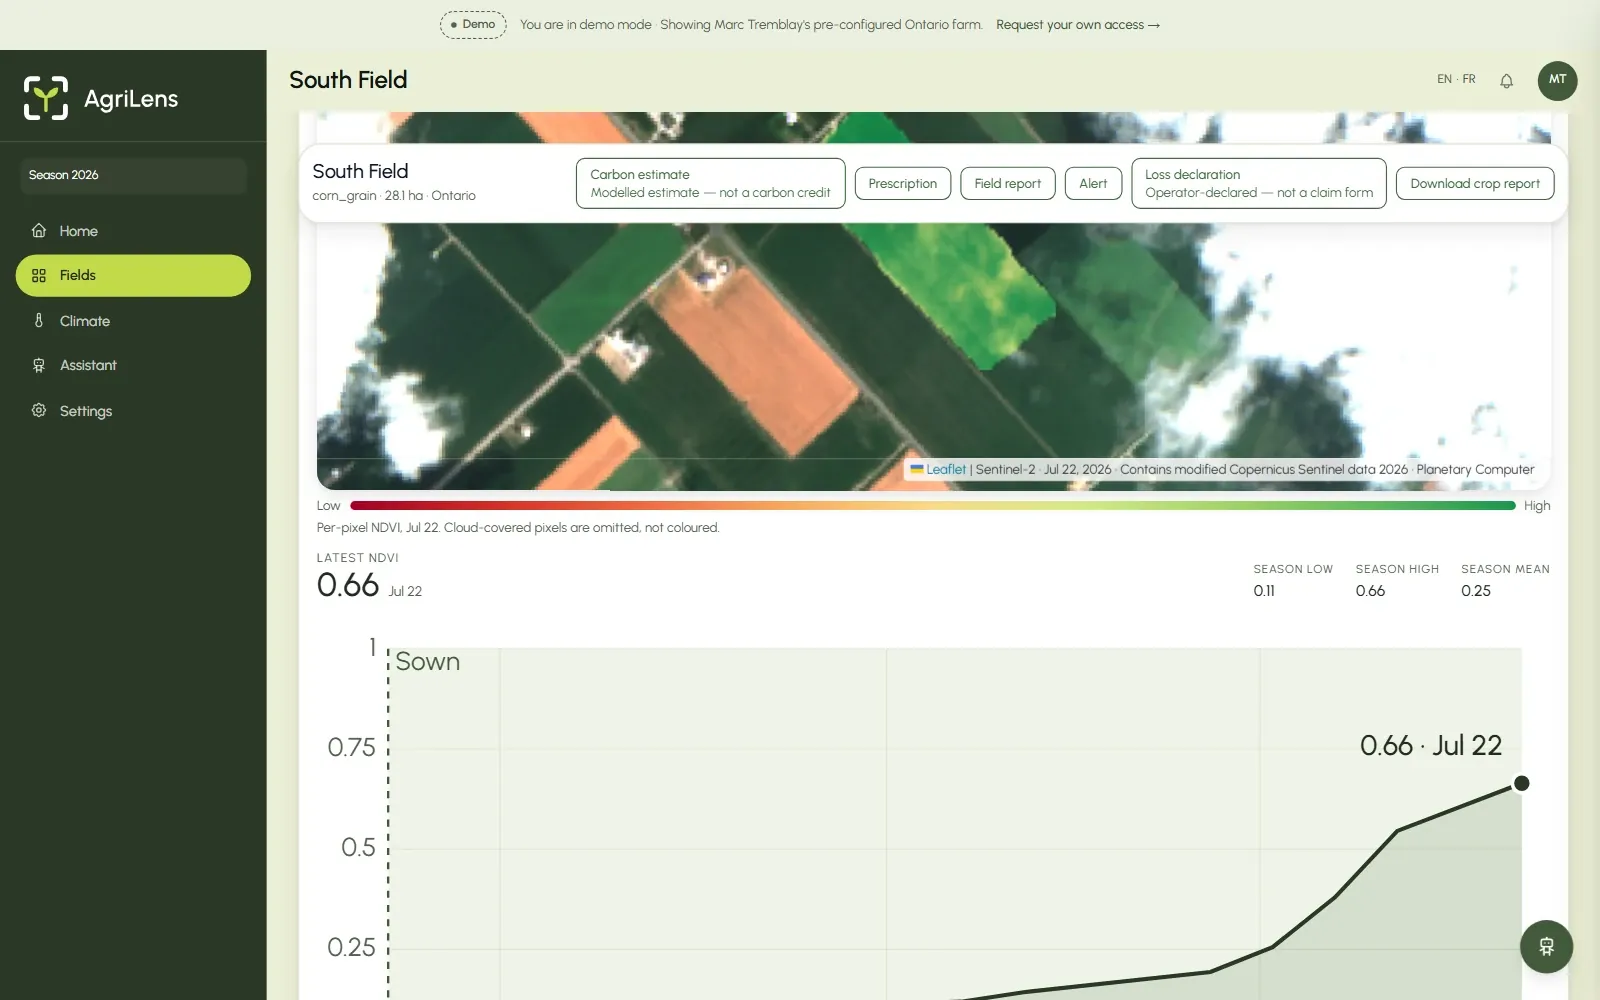
South Field crop-health map, 22 July 2026 (latest NDVI 0.66), and its NDVI time series since sowing. · AgriLens screen, Apex Intelligence · Contains modified Copernicus Sentinel data 2026
- 04 · LIVE
Yield forecasts with reasons
A forecast for each field before harvest, with a range and the factors that raised or lowered it.
EAST FIELD · 4.1 T/HA · 90% RANGE 2.7–9.0
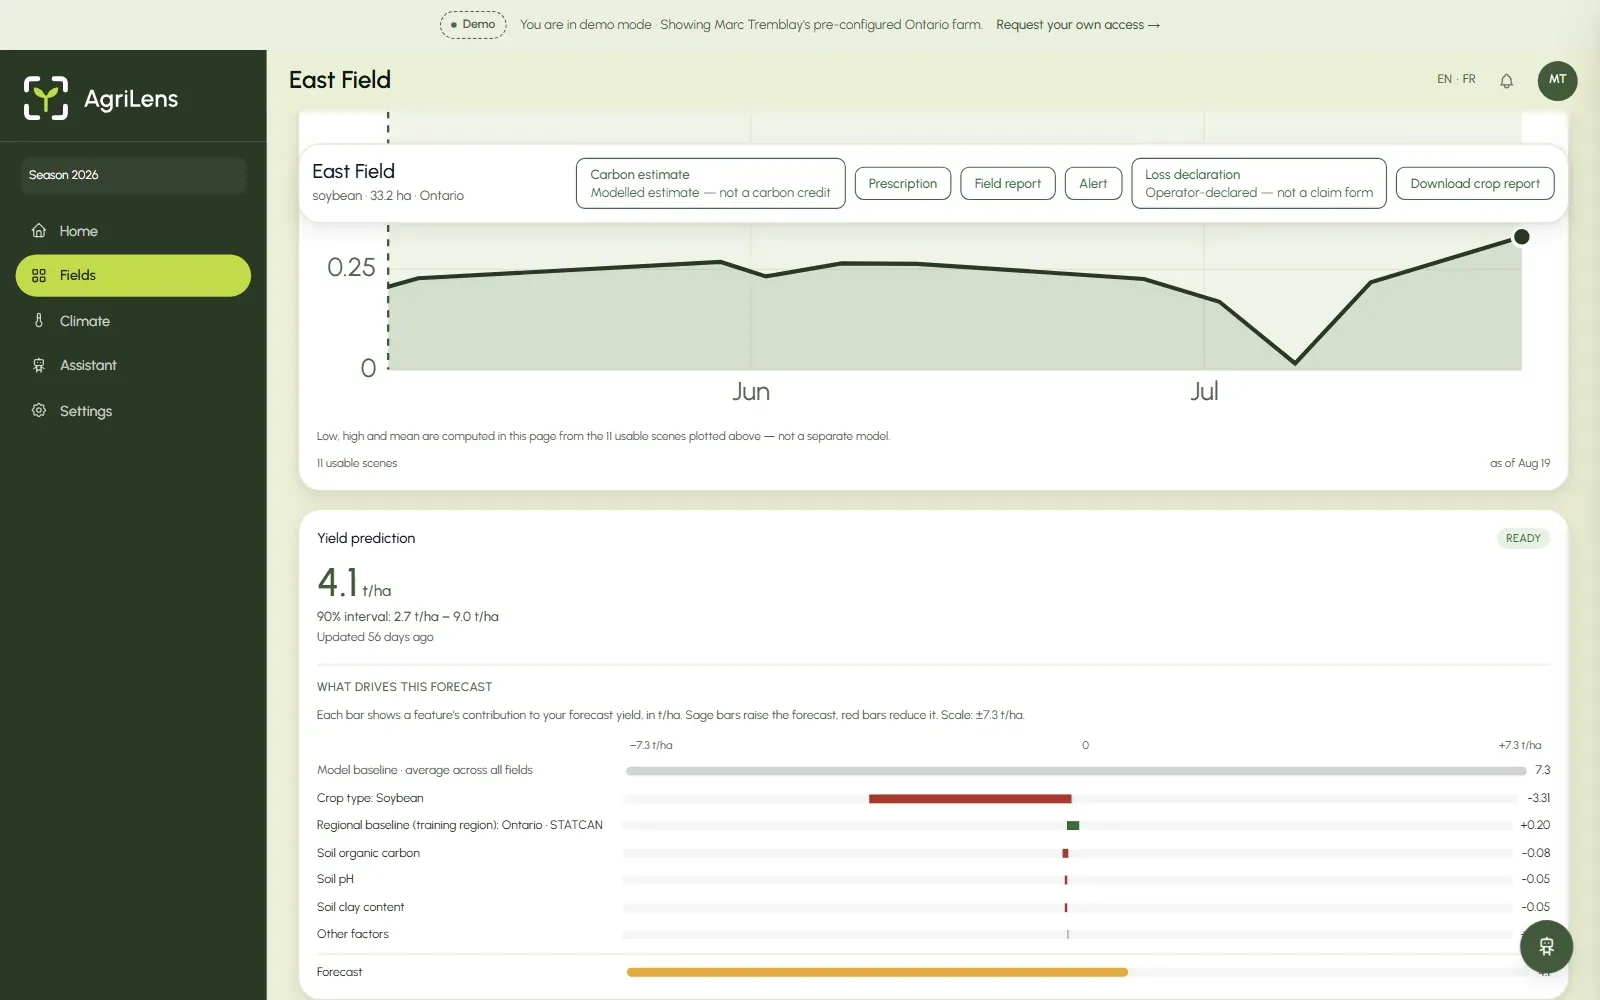
East Field (soybean) yield forecast: 4.1 t/ha, 90% interval 2.7 to 9.0 t/ha, and the factors that raised or lowered it, in t/ha. · AgriLens screen, Apex Intelligence · Contains modified Copernicus Sentinel data 2026
- 05 · LIVE
Agronomy assistant
Ask a crop question in plain language. Answers cite their source by page, or say when there isn’t one.
EVERY ANSWER CITES A SOURCE, OR SAYS SO
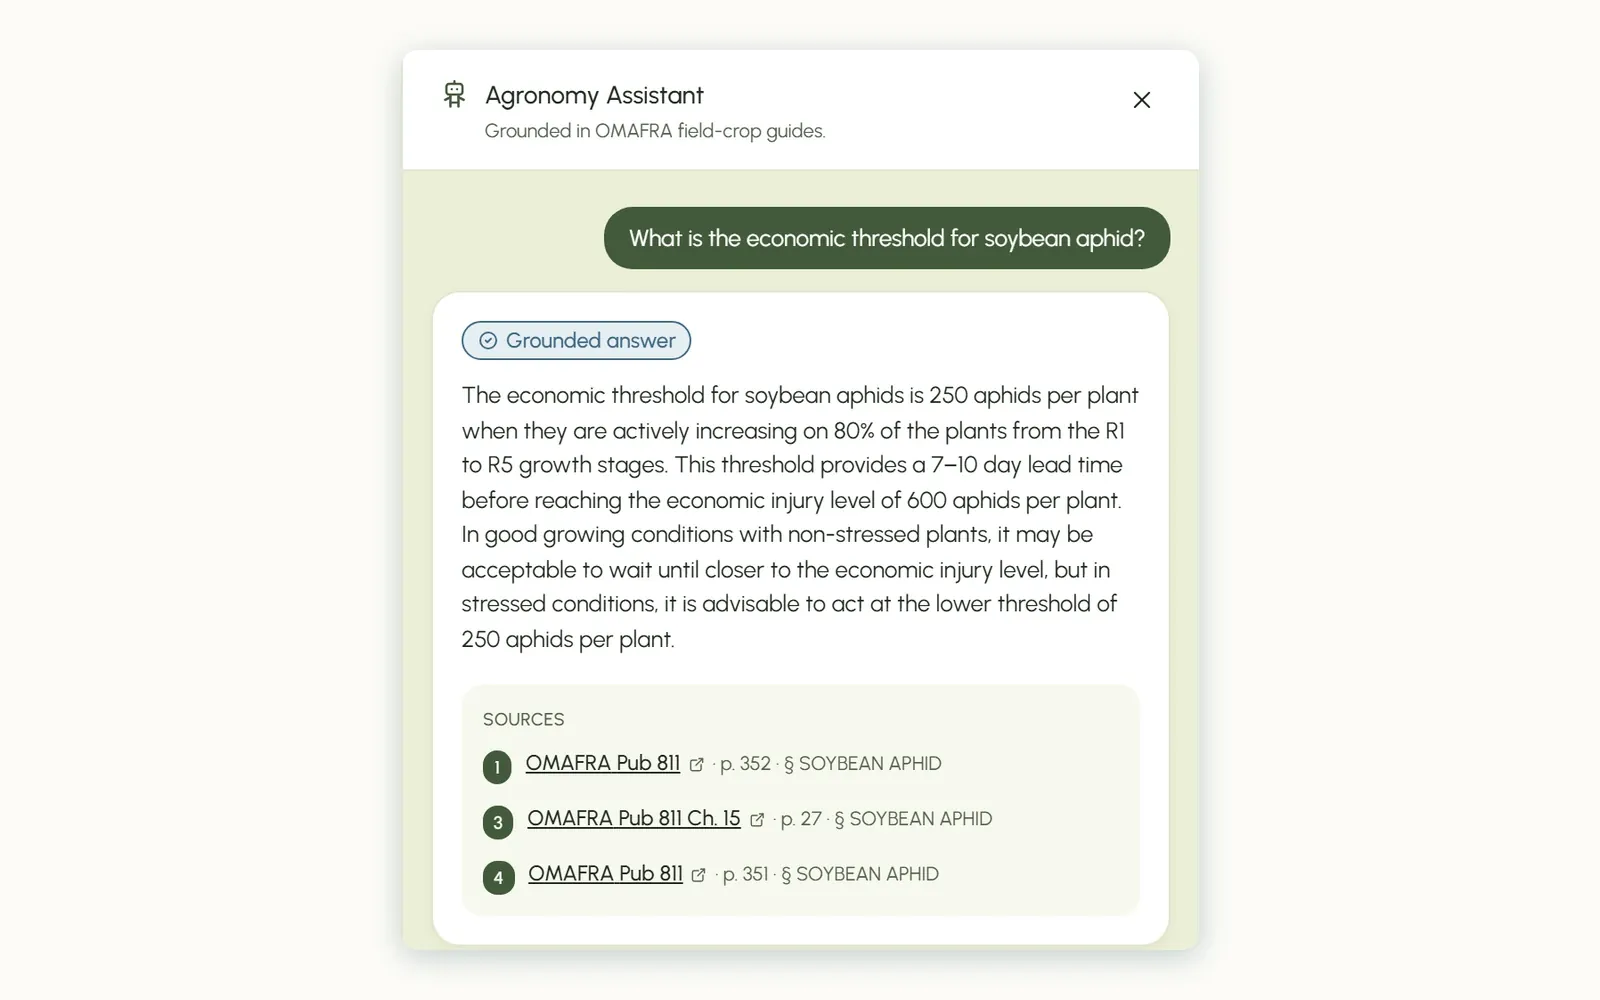
AgriLens Agronomy Assistant: a grounded answer on the soybean aphid threshold, citing OMAFRA Publication 811 by page. Captured 19 August 2026. · AgriLens screen, Apex Intelligence · Contains modified Copernicus Sentinel data 2026 · Sources cited: OMAFRA Publication 811, © King’s Printer for Ontario
- 06 · LIVE
Field reports
A proposed report for each field. Sections without enough evidence are marked not available, and nothing is saved until confirmed.
5 SECTIONS · 3 GROUNDED · 2 NOT AVAILABLE
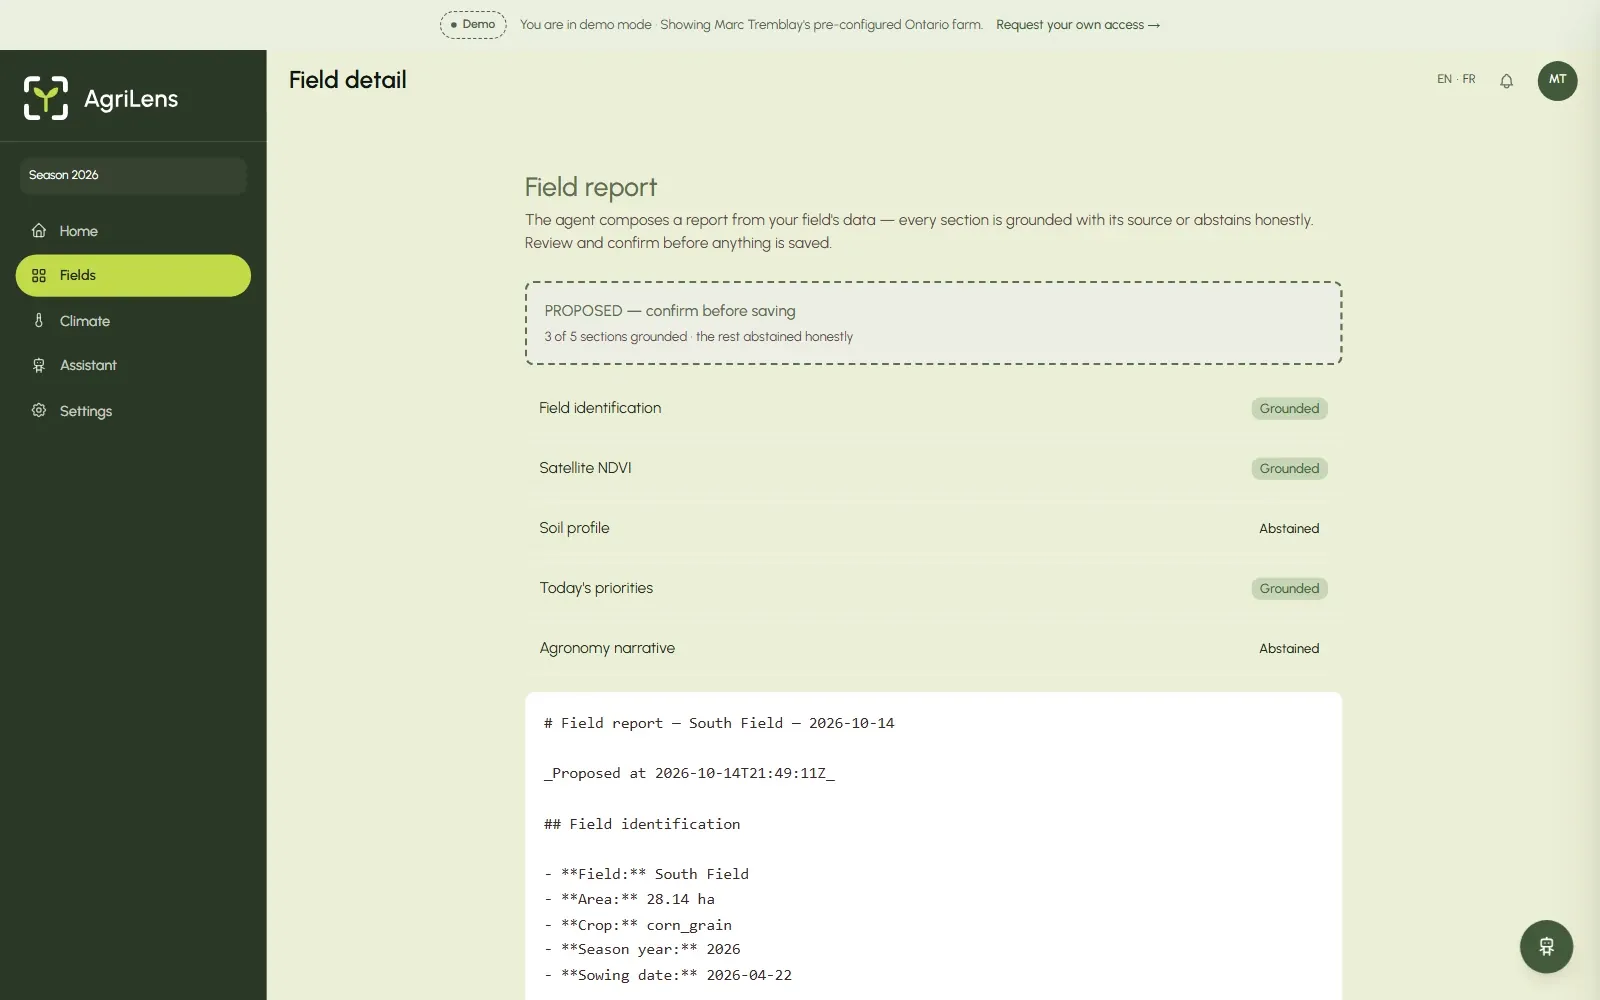
AgriLens field report for South Field: proposed, 3 of 5 sections grounded in their sources, the rest marked not available; nothing saved until confirmed. · AgriLens screen, Apex Intelligence · Contains modified Copernicus Sentinel data 2026
AgriLens home dashboard, demo farm · AgriLens screen, Apex Intelligence · Contains modified Copernicus Sentinel data 2026
AgriLens Fields page, Marc Tremblay demo farm, Chatham-Kent, Ontario: the four fields (141.5 ha) on the Sentinel-2 season basemap, with the field list. · AgriLens screen, Apex Intelligence · Contains modified Copernicus Sentinel data 2026
South Field crop-health map, 22 July 2026 (latest NDVI 0.66), and its NDVI time series since sowing. · AgriLens screen, Apex Intelligence · Contains modified Copernicus Sentinel data 2026
East Field (soybean) yield forecast: 4.1 t/ha, 90% interval 2.7 to 9.0 t/ha, and the factors that raised or lowered it, in t/ha. · AgriLens screen, Apex Intelligence · Contains modified Copernicus Sentinel data 2026
AgriLens Agronomy Assistant: a grounded answer on the soybean aphid threshold, citing OMAFRA Publication 811 by page. Captured 19 August 2026. · AgriLens screen, Apex Intelligence · Contains modified Copernicus Sentinel data 2026 · Sources cited: OMAFRA Publication 811, © King’s Printer for Ontario
AgriLens field report for South Field: proposed, 3 of 5 sections grounded in their sources, the rest marked not available; nothing saved until confirmed. · AgriLens screen, Apex Intelligence · Contains modified Copernicus Sentinel data 2026
FORECAST REASONS
Know why, not just what
Each yield forecast lists what raised or lowered it, in tonnes per hectare, so you can check it against what you know about the field. How it works, step by step
- 01Every estimate shows a range.
- 02Cloudy pixels are left out, not guessed.
- 03Answers name their source, or say they don't know.
What drives this forecast
East Field · t/ha
RESULTS
66s
From drawing a field to its first analysis.
0.89R²
Yield forecast fit, tested on seasons the model never saw.
6
Open data sources, each named.
EN/FR
Every map, report and answer in both languages.
0 / 14
platforms in our April 2026 review offered per-forecast explanations.
Review of 14 crop platforms · April 2026 · platforms not named
ON A PHONE
Take it to the field
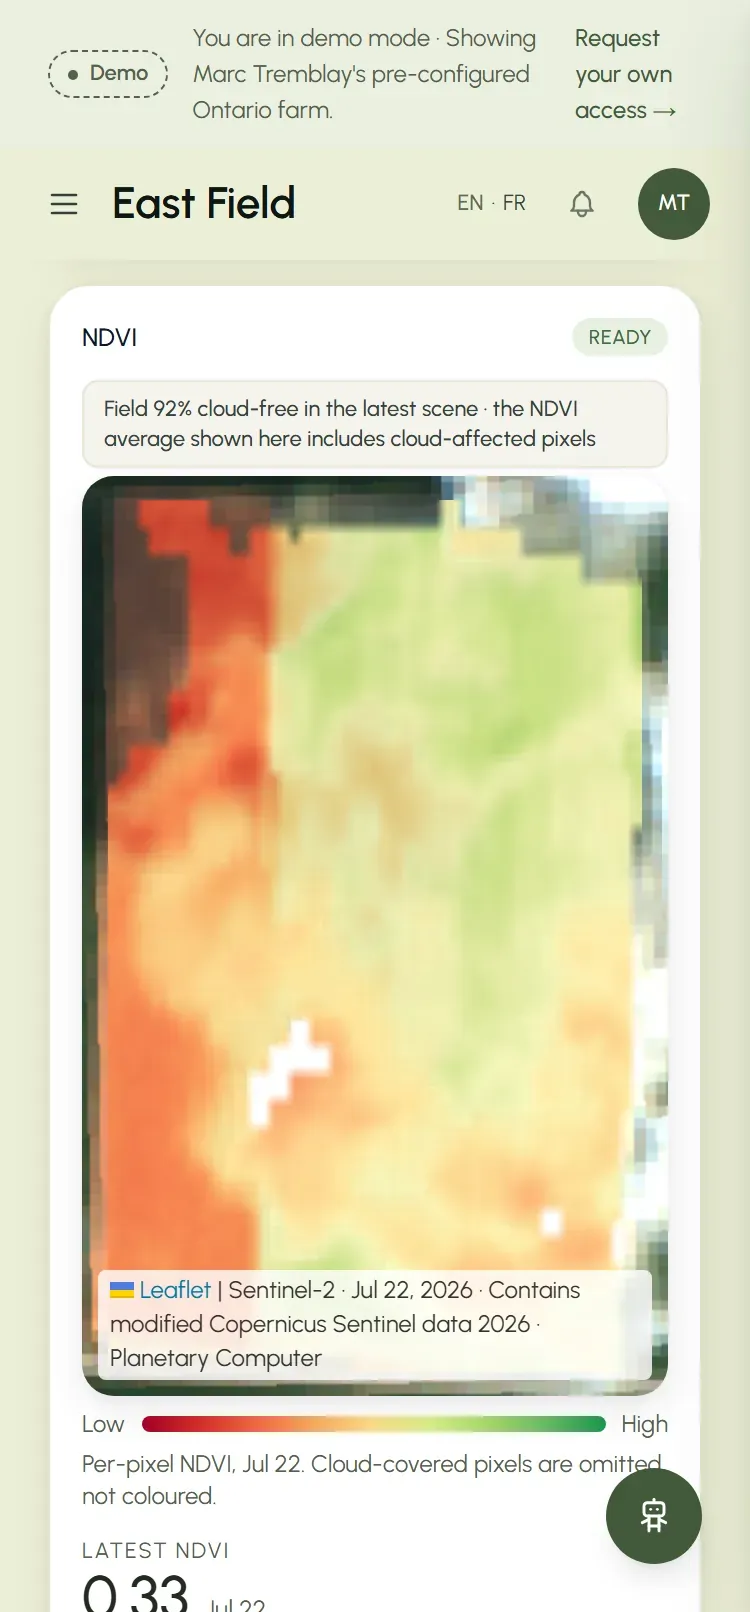
The same field view works on a phone, for checking crop health from the truck or the edge of the field.
WHAT WE CAN BUILD FOR YOU