
Crop health maps
Where each field grows well or falls behind, after every clear pass.
- DATA
- Sentinel-2, 10 m
- OUTPUTS
- Maps, GIS layers, field table
- TYPICAL TIME
- Live after each clear pass
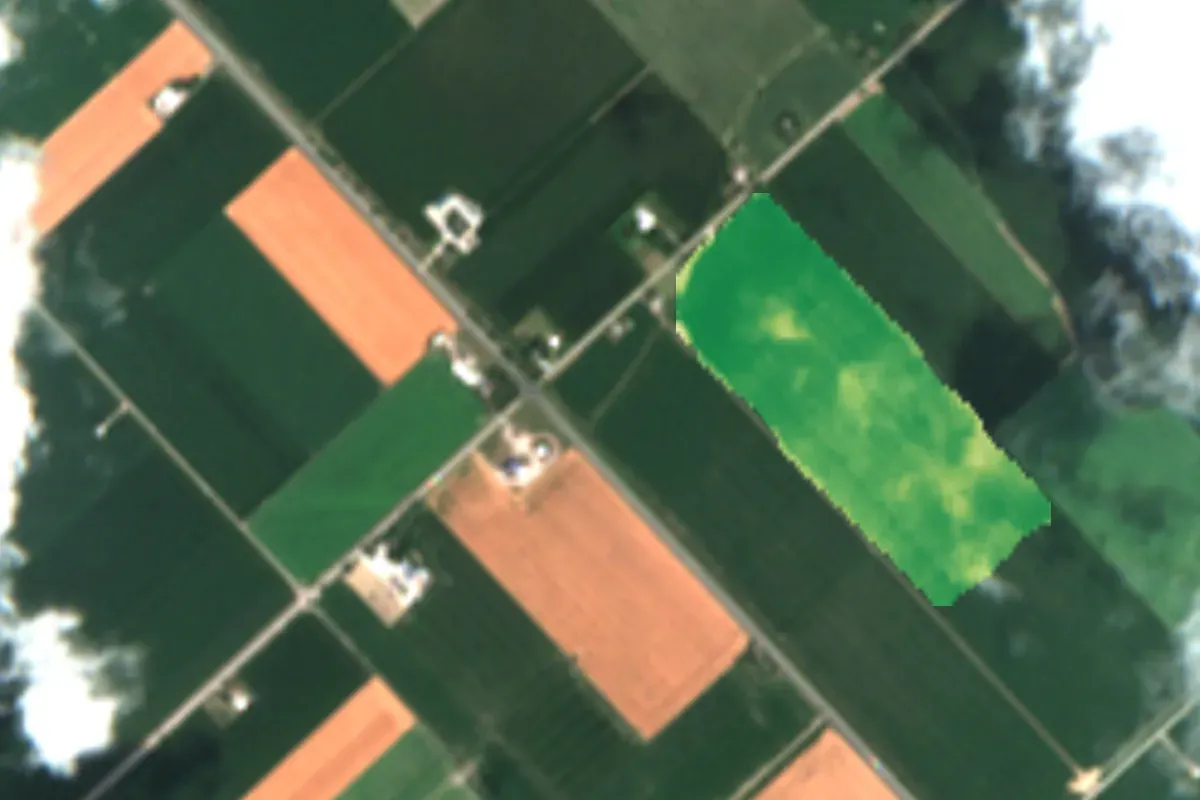
What you can do with it
- 01See which parts of a field are ahead or behind before you walk it
- 02Send scouting to the places that changed since the last pass
- 03Compare fields across the farm on one scale
- 04Keep a season record for every field
METHOD
How it is made
Every number names its data and its limits.
- DATA USED
- Copernicus Sentinel-2 surface reflectance, every clear pass. Field outlines drawn from satellite images or supplied by you.
- METHOD OR MODEL
- Vegetation index per pixel (NDVI), masked for cloud and shadow, summarised per field and per season.
- ACCURACY AS MEASURED
- Cloud mask applied per pass; masked pixels are left empty, not filled. Field-level values are reported with the share of clear pixels.
- WHAT THIS DOES NOT TELL YOU
- A low value says the canopy is thinner or stressed. It does not say why: drought, pests, disease and nutrient gaps look alike until checked on the ground.
- LANGUAGES
- English and French
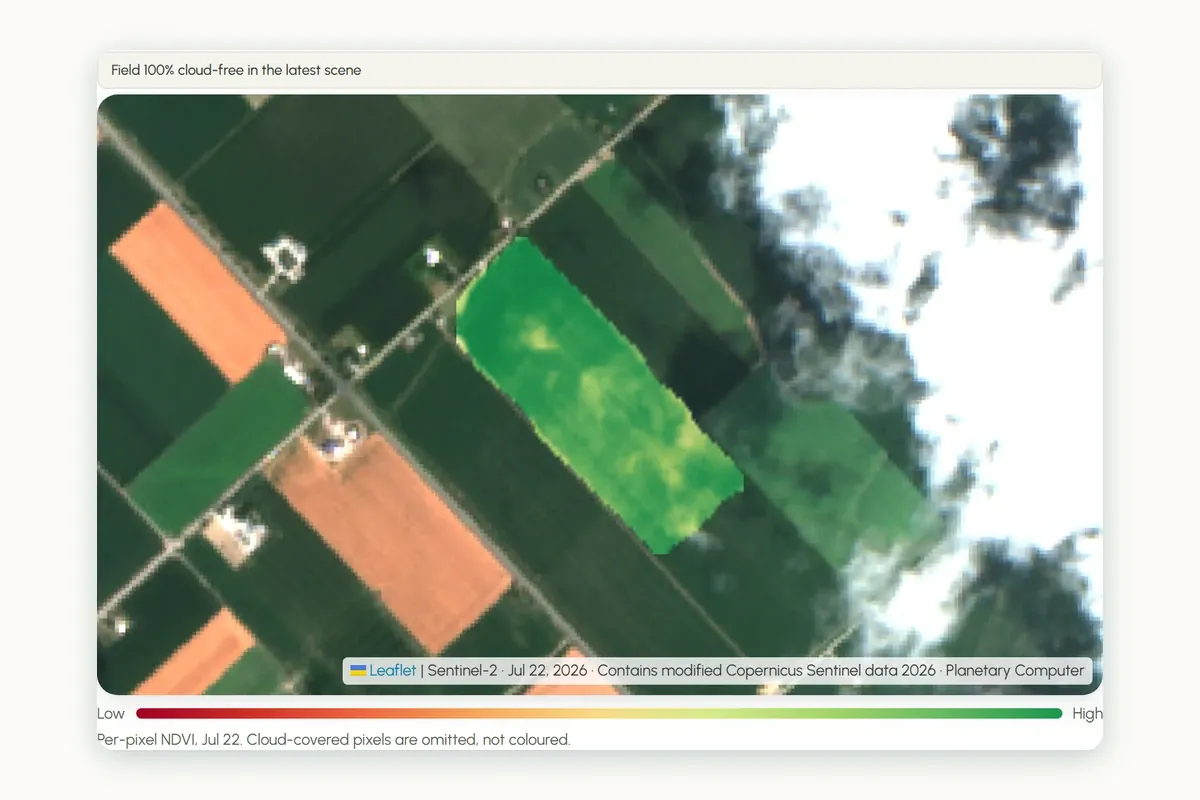
WHAT YOU RECEIVE
Maps and data in your formats
- GeoTIFF per pass
- GeoPackage of field summaries
- CSV time series per field
- PDF season report
- Dashboard (AgriLens)
WHAT WE NEED FROM YOU
- Field outlines, or permission to draw them
- Crop per field, if known
- Your area and season of interest
WHAT WE PREPARE
- Scene search and cloud masking
- Index calculation per pass
- Field summaries and the season record
- Maps, layers and the report
Steps and time
- Discovery1–2 weeksOutlines confirmed, first maps for one season
- Build2–3 weeksPipeline for your area, dashboard or layers in your GIS
- RunEach seasonNew maps after each clear pass, season report at the end
DISCUSS THIS SOLUTION
Tell us about your area
We reply with a first view on whether this fits, and what discovery would cover.